

.png)
On 1 October at 00:01 EDT (06:01 CEST), it became official: the US federal government glided into its first shutdown in nearly seven years. This implies that about 40% of the US government services will be furloughed and halt operations. The previous shutdown occurred in the end of 2018 during Trump's first administration and lasted 35 days.
The shutdown resulted from a partisan deadlock over the spending bill. President Donald Trump's Republican Party controls both chambers of Congress but lacks the 60 votes needed in the Senate to pass the spending bill without Democratic support.
The core of the disagreement centres on healthcare policy and government spending priorities. Democrats refused to back the Republican funding proposal, arguing it would make healthcare less affordable for Americans. Their key demands included: an extension of tax credits that make health insurance cheaper for millions of Americans—which are set to expire, a reversal of cuts to Medicaid that have been made under the Trump administration, and opposition to spending cuts targeting the Centers for Disease Control (CDC) and National Institutes of Health (NIH).
Republicans proposed a shorter seven-week funding extension focused primarily on additional security funding for government branches, but this did not address the healthcare subsidies and public health funding that were priorities for democrats. A stopgap bill passed in the House of Representatives but failed to clear the Senate due to this partisan impasse.
What will happen now?
A shutdown affects only discretionary spendings. This implies that programs such as food assistance, federally funded preschool, food inspections, and operations at national parks are likely to face temporary closures.
On the other hand, mandatory spendings and programs not funded by congressional appropriations, continue and the employees necessary to the operation of those programs will continue to work but with no pay until the restoration of funding.
Mandatory spendings include benefit programs like Medicare, Medicaid and Social Security, as well as interest expenses on federal debt and disbursement of student loans. Together, these mandatory programs account for around 75% of federal spending.
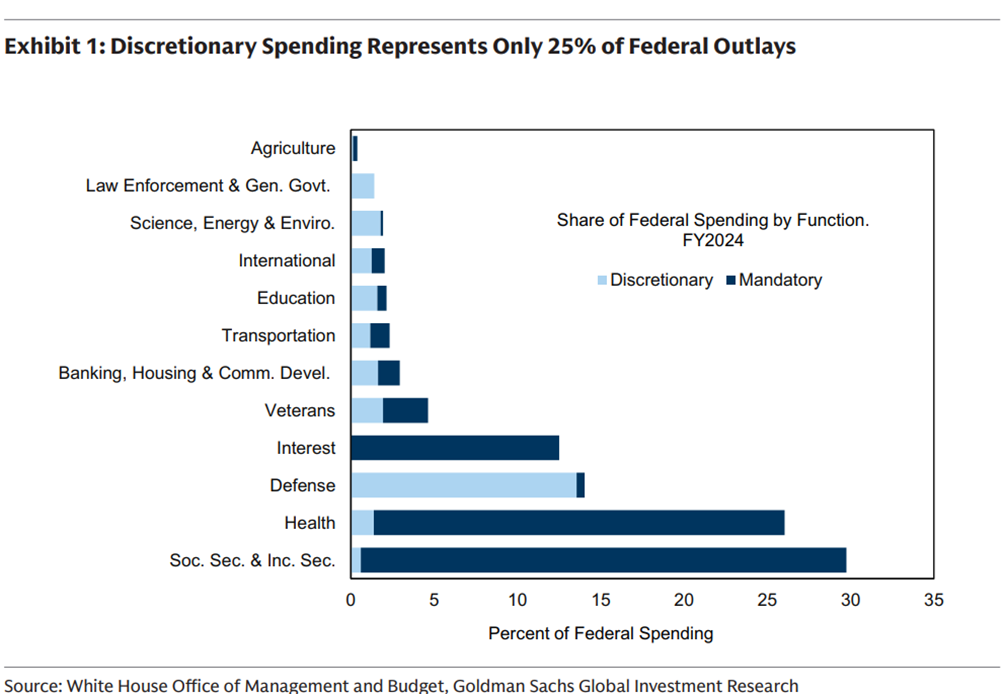
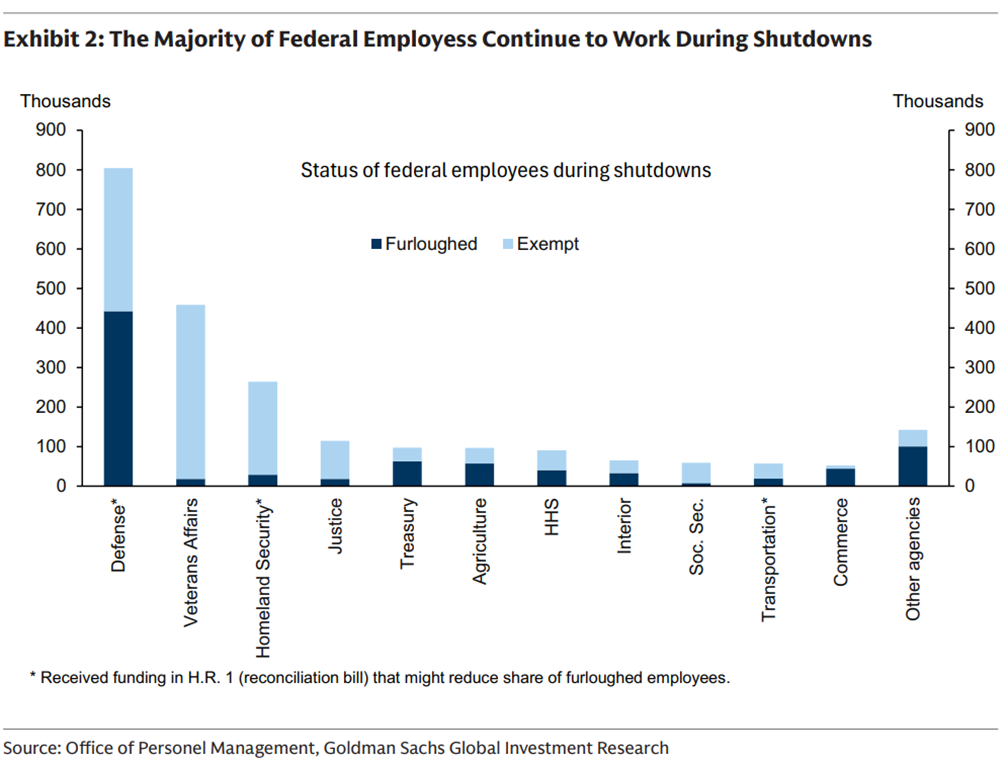
The largest function in terms of discretionary spendings is defence, accounting for around half of total discretionary spending. In addition to federal employees needed to operate mandatory spending programs, part of the employees working in discretionary programs will be exempt from furlough. More specifically, the ones occupying roles involving the “safety of human life or the protection of property”, such as law enforcement, border control, and air traffic control. Overall, this means that only around 40% of federal civilian employees, around 900k, are furloughed.
Where is my data?
Regarding economic data, nearly all federal releases will be postponed until after the end of the shutdown and it took often days or even weeks to resume the publication of all the economic data after the shutdown ended. Additionally, subsequent data releases are at risk of being delayed if data collection is affected. Among the federal agencies responsible for economic data releases that will suspend the collection and distribution of data figure the Bureau of Labor Statistics (BLS), the Bureau of Economic Analysis (BEA), and the Census Bureau. For example, in 2013, the employment and CPI reports, published by the BEA and BLS, of September and October had to be postponed, with disruptions caused to subsequent releases through December. Additionally, the BLS had highlighted that the prices sample used in the calculation of the October 2013 CPI was about 75% of the usual amount. However, data releases such as the weekly jobless claims published by the Department of Labor and the Daily Treasury Statement published by the Treasury are likely to continue. Furthermore, releases published by the Federal Reserve should also continue, since the latter doesn’t rely on congress for funding.
Economic impacts
Typically, the shutdowns affect all the non-essential parts of the government and the estimated more than 800 thousand furloughed federal employees will trigger a drop of about 11 billion in compensation and a roughly 0.15 to 0.2 percentage point drag for the quarterly GDP growth, for each week the shutdown persists.
Likewise, and depending on the way the federal office is counting the furloughed federal employees, the unemployment figure will likely increase by 0.1 to 0.2pp if the shutdown persists long enough into the reference week for the statistics. Finally, there should be no significant effect on CPI data, aside from the fact that the releases will be delayed during the shutdown and may even be postponed for several days or weeks after a prolonged shutdown before resuming.
Market reaction
Previous government shutdowns episodes have produced mixed impacts across equities, interest rates, and the dollar.
Treasury yields have more commonly fallen when shutdowns begin, and the dollar has depreciated against major currencies in the majority of cases. Yet the movements in the Dollar Index, a gauge tracking the greenback versus the euro, yen, pound sterling, and other currencies, have typically been muted. The dollar had already lost nearly 10% of its value, weighed down by market uncertainty over trade policy and tariffs. The dollar did not react significantly following the announcement.
Bond markets sometimes benefit from flight-to-quality flows as investors rotate toward perceived safety, though these effects generally prove temporary. A government shutdown might also question the US credit rating. A government shutdown means the government can issue debt but not spend it, and this is an important point as the One Big Beautiful Bill Act raised the debt ceiling, likely moving a credit downgrade off the table. However, repeated warnings by the three major rating agencies about increasing fiscal and budget risks still cause doubts. One such warning was in May, when Moody’s decided to downgrade the US credit rating.
Stocks have historically treated shutdowns with relative indifference. Data spanning 20 episodes since 1976 reveals virtually no systematic impact on the S&P 500 during shutdown periods. More tellingly, equity movements that occurred during shutdowns generally persisted after resolution, suggesting that broader economic conditions, not the shutdowns themselves, were driving returns. Looking at subsequent 12-month performance, stocks have delivered average gains near 2.17% following shutdowns. Of course, these comparisons have always to be taken with a pinch of salt, as the shutdown periods came at different times and different economic environments
The 2018-2019 shutdown is an outlier. The S&P 500 rose more than 10% during that five-week period, but this followed a significant sell-off driven by concerns about declining corporate earnings and Federal Reserve rate increases. The market recovery coincided with, rather than resulted from, the shutdown. Today, the S&P 500 is up more than 13% year-to-date, the Nasdaq Composite has gained 17%, and the Dow Jones Industrial Average is up nearly 9%.
Conclusion
Given the market’s often muted reactions and the expectation that political pressure will once again lead to an agreement in Congress and the eventual passing of the spending bill, we are maintaining our current asset allocation and making no changes. While there is always a risk that even a small drop in consumer spending or income could alter the outlook, we believe the US economy remains resilient enough for consumers to keep spending overall.
We also expect the Fed not to be impressed by the shutdown, and we stick to our view that the central bank will likely deliver less monetary policy easing than what markets are currently expecting. That said, if a prolonged shutdown increases uncertainty around labour or inflation data, or even triggers a more persistent drop in consumption, the Fed could respond with additional 'risk-management' cuts. However, volatility is part of everyday market life, and we will continue to monitor the next steps in US politics closely.
Disclaimer
This marketing document has been issued by Bank Syz Ltd. It is not intended for distribution to, publication, provision or use by individuals or legal entities that are citizens of or reside in a state, country or jurisdiction in which applicable laws and regulations prohibit its distribution, publication, provision or use. It is not directed to any person or entity to whom it would be illegal to send such marketing material. This document is intended for informational purposes only and should not be construed as an offer, solicitation or recommendation for the subscription, purchase, sale or safekeeping of any security or financial instrument or for the engagement in any other transaction, as the provision of any investment advice or service, or as a contractual document. Nothing in this document constitutes an investment, legal, tax or accounting advice or a representation that any investment or strategy is suitable or appropriate for an investor's particular and individual circumstances, nor does it constitute a personalized investment advice for any investor. This document reflects the information, opinions and comments of Bank Syz Ltd. as of the date of its publication, which are subject to change without notice. The opinions and comments of the authors in this document reflect their current views and may not coincide with those of other Syz Group entities or third parties, which may have reached different conclusions. The market valuations, terms and calculations contained herein are estimates only. The information provided comes from sources deemed reliable, but Bank Syz Ltd. does not guarantee its completeness, accuracy, reliability and actuality. Past performance gives no indication of nor guarantees current or future results. Bank Syz Ltd. accepts no liability for any loss arising from the use of this document.
Related Articles
Meanwhile, Wall Street's long-term earnings expectations for the S&P 500 are now at record levels. Each week, the Syz investment team takes you through the last seven days in seven charts.
Meanwhile, corporate leadership is evolving rapidly: only 135 of the S&P 500 constituents from 1996 are still in the index today, while the EU goods trade deficit with China is close to a record €376bn. Each week, the Syz investment team takes you through the last seven days in seven charts.
Meanwhile, Trump’s personal crypto earnings in 2025 topped the combined profits of every publicly listed US crypto company. Each week, the Syz investment team takes you through the last seven days in seven charts.