What happened last week?
Central banks: The core PCE index, one of the most closely watched inflation indicators by the Federal Reserve (Fed), was released on Friday and remained at an elevated level, but fell more than expected (+5.0% vs. 5.1%). This is consistent with statements from the Fed's Collins that additional tightening is needed as inflation remains too high and the Fed's Kashkari who remains concerned about rapid wage growth in the service sector. By the end of the first quarter of 2023, the market expects only one more hike in May (probability >60%) for a terminal rate at 5.00-5.25%. In Europe, while eurozone headline inflation slowed considerably from 8.5% in February to 6.9% in March, core CPI accelerated to 5.7%, a new all-time high, indicating that inflationary pressure remains high. ECB President Lagarde recently reiterated concerns that core inflation is "far too high" and that the ECB still has "ground to cover" to bring inflation back to 2%. The market expects two more hikes and a terminal deposit facility rate of 3.5% (up from 3.0%).
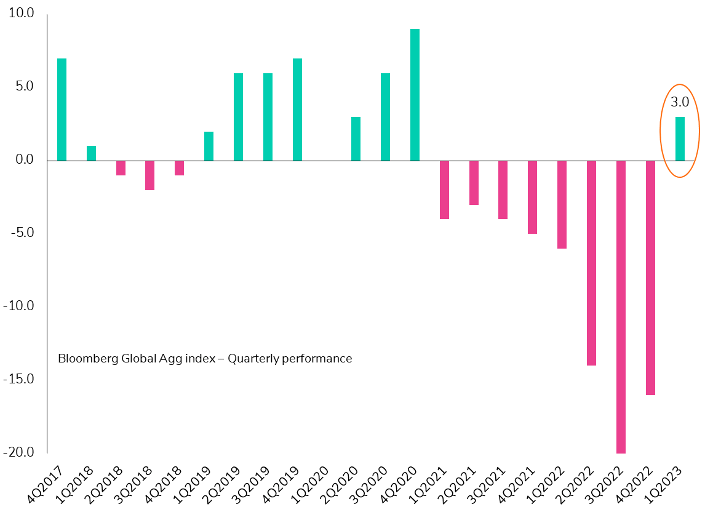
Rates: The 10-year U.S. Treasury yield ended the quarter at 3.5%, compared to 3.9% at the beginning of the year. March saw a sharp re-pricing of the front-end of the U.S. Treasury curve, with the 2-year yield falling 80 bps, while the 10-year yield fell "only" 40 bps. We are back to where we were at the beginning of the year, with a -56 bps slope between the 2-year and 10-year. On average, the yield curve fell by 40 bps during the quarter, generating a gain of 3% (+2.9% in March) for US Treasuries. In Europe, the situation is quite similar but less exacerbated: the German 10-year yield ended at 2.3%, down 20 bps over the quarter and 35 bps in March. The main difference is the slope of the yield curve, which inverted by 20 bps over the quarter to -40 bps. German government bonds gained 2% in the first quarter (+2.5% in March), while Italian bonds outperformed with a gain of 3.7% (+2.3% last month). The spread between Italian and German 10-year yields is now 180 bps.
Credit: U.S. Investment Grade (IG) bonds have performed very well year-to-date: +3.5% for the quarter, while the segment gained +2.6% in March. IG corporate bond spreads ended at 138 bps, widened by 24 bps in March and by 8 bps in the quarter. In the high yield (HY) sector, investors seem to be holding onto some positive signs to push the segment higher (+1.7% on the week!). Multi-Color Corp reopened the primary market, the first HY deal in over three weeks, and Netflix was upgraded to IG by Moody's, becoming the latest rising star in the U.S. market. In March, U.S. HY bonds managed a solid positive performance (+1.1%), ending the quarter at +3.6%. But the segment clearly deteriorated, with credit spreads widening by 40 bps in March to 455 bps. In Europe, the rebound in the AT1 segment (+5% on the week) made investor sentiment positive on credit: European HY bonds gained nearly 1% on the week. European IG bonds gained 1% in March and +1.8% over the quarter, while European HY bonds retracted -0.4% in March, but performed solidly over the first quarter (+2.9%). Despite a sharp increase in credit spreads in March, +22bps and 53bps for EUR IG and HY respectively, the European credit market managed to be stable over the quarter with EUR IG ending at 170bps (+3bps) and EUR HY at 497bps (-15bps).
Emerging market: The recovery seems underway in China, confirming by another good PMIs in March, especially with a strong print in PMI services (58.2 vs 55 exp.). Mexico and South Africa continue to tighten monetary policy by raising interest rates by 25 bps to 7.75% and 11.25% respectively, showing that high rates are still not enough to curb inflation. Despite a strong month for U.S. Treasuries, emerging market (EM) corporate bonds “only” gained 1.1%. The risk related to EM debts, as expressed by their credit spreads, increased significantly in March with a widening of nearly 50bps on the Bloomberg EM Corporate bonds spreads. In the first quarter, EM debts posted a 2% gain for sovereign and corporate bonds in hard currency and a 3% gain for local currency debt.


.png)
