What happened last week?

Central banks: The March BLS data once again showed the robustness of the US labor market. Unless the CPI data is very bad (released tomorrow), the jobs report should confirm the Fed's decision to raise rates by only 25 bps at their May meeting. The market is currently pricing in an 80% chance of such a scenario, while Fed members Williams and Bullard focused on tempering the impact of the Fed's action on failed banks. In Europe, ECB members reiterated their commitment to raising the deposit facility rate. ECB Knot is still open to a 50 bps hike at the May meeting, which he sees as an "almost impossible" change from a rate cut, while Spanish Central Bank President De Cos still expects further hikes as "inflationary pressures continue to build." The market considers the probability of a 25 bps increase to be close to 100%.  
Rates: U.S. Treasuries performed well (+0.6%) last week, with the 10-year U.S. Treasury ending the week at 3.4%, down 7 bps. Mixed employment data (good BLS report vs. weak jobless claims) did not influence the yield curve too much as the 2-year U.S. Treasury yield fell 5 bps (and back below 4%), inverting the yield curve by only 2 bps. On the other hand, the spread between 3-month and 10-year U.S. Treasuries reached a new low at -157 bps. In Europe, government bonds started the month on a high note with a performance of +0.9%, with the German 10-year yield ending at 2.18%, down 11 bps on the week. Peripheral rates slightly underperformed core rates with a modest gain of 0.6%.

Credit: U.S. Investment Grade (IG) bonds continued to perform well, adding 40 bps to the 2023 performance (+3.9%). The rate component more than offset the slight widening of the credit spread (+3bps to 140bps). HY credit spreads widened by 10 bps to 465 bps, reflecting weak investor sentiment and activity in the HY primary market (nearly $8 billion of new issuance). In Europe, it was a similar week, with EUR IG having a strong start to the month (+0.8%) while EUR HY was up only 0.1%. European HY credit spreads widened by almost 20 bps due to the lower quality (CCC) and real estate sector (-1.2% on the week).

Emerging market: The Reserve Bank of India surprised the market by keeping its key interest rates unchanged at 6.5%, indicating that rates are already in restrictive territory. In China, the Caixin PMI Composite (54.5 vs. 54.2) confirmed the positive momentum of the Chinese recovery, while the Chinese real estate market appears to be stabilizing. Indeed, March data showed an increase in long-term loans for households, while new home sales by the country's 100 largest property developers rose by 30% yoy. Against this backdrop, emerging market indices have risen since the beginning of the month, with hard currency sovereign bonds rising 0.5% and dollar corporate bonds rising 0.7%. Credit spreads narrowed by 10 bps and 3 bps to 415 bps and 376 bps, respectively, for the EM sovereign and corporate indices.  


Our view on fixed income (April)

Rates
CAUTIOUS
We favor the front end of the Treasury curve, which offers decent carry and low interest rate sensitivity. The yield curve inversion and inflation plead for staying cautious on long term bonds even if they can offer an attractive hedge against potential negative scenarios.


Investment Grade
POSITIVE

Recent developments have increased downside risks but Investment Grade continues to offer value. The risk/reward remains attractive due to the high level of carry. We were already positive on the front end of the credit yield curve, we are moving to longer investments in the 5-10 year segments. 

High Yield

UNATTRACTIVE

High yield bonds could come under pressure in this very uncertain environment. Recession fears, expectations of higher default rates and one of the most aggressive monetary policies are expected to weigh on this segment.


EM
CAUTIOUS

Emerging market bonds have rallied impressively, outperforming investment grade US corporate bonds by more than 5% over the past six months. But rising idiosyncratic risks and the tight premium to investment grade bonds make us tactically cautious.


The Chart of the week

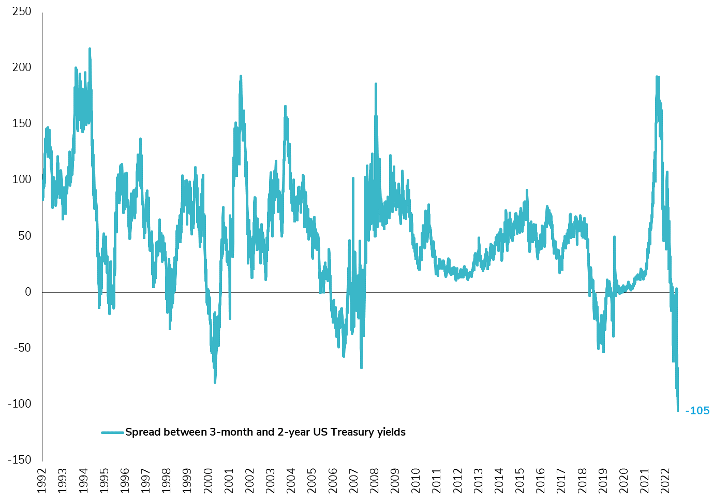
The most inverted short-term US Treasury yield curve in history!

Picture1-4

Source: Bloomberg

For the first time, the spread between the 3-month and 2-year U.S. Treasury yields reached -100 bps. This is a very good reflection of the dichotomy between the current path of Federal Reserve rate policy (reflected in the 3-month yield) and the market's view of the future path of rate policy (2-year yield). As a result, the market currently expects significant rate cuts from the Federal Reserve in the coming months. Who will be the first to give up?

Disclaimer

This marketing document has been issued by Bank Syz Ltd. It is not intended for distribution to, publication, provision or use by individuals or legal entities that are citizens of or reside in a state, country or jurisdiction in which applicable laws and regulations prohibit its distribution, publication, provision or use. It is not directed to any person or entity to whom it would be illegal to send such marketing material. This document is intended for informational purposes only and should not be construed as an offer, solicitation or recommendation for the subscription, purchase, sale or safekeeping of any security or financial instrument or for the engagement in any other transaction, as the provision of any investment advice or service, or as a contractual document. Nothing in this document constitutes an investment, legal, tax or accounting advice or a representation that any investment or strategy is suitable or appropriate for an investor's particular and individual circumstances, nor does it constitute a personalized investment advice for any investor. This document reflects the information, opinions and comments of Bank Syz Ltd. as of the date of its publication, which are subject to change without notice. The opinions and comments of the authors in this document reflect their current views and may not coincide with those of other Syz Group entities or third parties, which may have reached different conclusions. The market valuations, terms and calculations contained herein are estimates only. The information provided comes from sources deemed reliable, but Bank Syz Ltd. does not guarantee its completeness, accuracy, reliability and actuality. Past performance gives no indication of nor guarantees current or future results. Bank Syz Ltd. accepts no liability for any loss arising from the use of this document.

Read More

Straight from the Desk

Syz the moment

Live feeds, charts, breaking stories, all day long.

Thinking out loud

Sign up for our weekly email highlighting the most popular posts.

Follow us

Thinking out loud

Investing with intelligence

Our latest research, commentary and market outlooks