Gaël Fichan

Head Fixed Income & Senior Portfolio Manager

What happened last week?

  • Central banks: The Fed minutes essentially revealed that the process of tightening monetary policy is expected to continue at least until the second quarter of 2023. New Zealand's central bank raised its policy rate by 50bps to 4.75%, the highest rate in the developed world, while the Bank of Korea kept its policy rate unchanged at 3.5%, contemplating further interest rate hikes if inflationary pressures persist. Finally, the Bank of Turkey, unlike its counterparts, resumed its easing by reducing its rate by another 50 bps to 8.5%, while its inflation remains above 55%.
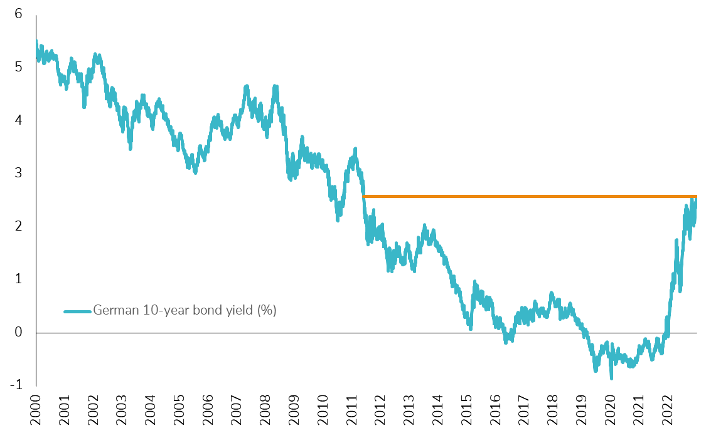
  • Rates: The Fed's preferred inflation indicator accelerates again in January with core PCE at 4.7%. This is the first year-over-year increase in the core PCE index since September. This hot data caused the front end of the U.S. yield curve to explode with another 20 basis point jump to finally reach a new high above 4.8% for the 2-year rate. The market has now built in some probability that the Federal Reserve may raise rates by 50 basis points at the March FOMC meeting and the final rate will be close to 5.5%. The U.S. 10-year Treasury finished the week below 4% again, at 3.94%. In Europe, Eurozone core CPI hit a new record high of 5.3%, pushing the German two-year bond yield above 3% for the first time since 2008! The market now expects a final rate of 3.75%, which would be the highest ECB deposit facility rate since the inception of the European Central Bank. Finally, the German 10-year bond yield ended the week above 2.5% for the first time in 2023.
  • Credit: U.S. investment grade bonds suffered again last week, with wider credit spreads and negative total returns. The Bloomberg U.S. Investment Grade Corporate Bond Index lost 1% for the week, and -3.4% month-to-date. U.S. high yield bonds had a less terrible week thanks to tightening credit spreads. The Bloomberg US high yield index lost less than 0.2% for the week, despite the second largest daily outflow from one of the largest US high yield bond ETFs (JNK). This ETF had a daily outflow of $1 billion (over 10% of assets under management). The only time we've seen that was in June 2020. But keep in mind that U.S. high yield, despite a very stretchy valuation, is less exposed to duration risk and an improving U.S. economic outlook could prevent a sharp rise in defaults (so far). In Europe, investment grade and high yield bonds lost about 0.5% on the week, mainly due to the negative performance of the rate component. The iTraxx Xover rebounded 400 to 420 basis points on the week.
  • Emerging market: Emerging market corporate bonds lost 0.7% last week, down 2.4% month-to-date. But despite the negative weekly performance, we have seen some stabilization in credit spreads (flat at 330bps), a (temporary?) sign of less volatility ahead? Note that the yield to maturity on the Bloomberg Emerging Markets Corporate Bond Index has returned to 7.75%.  

Our view on fixed income (February):

Rates
CAUTIOUS
The front end offers a decent carry and low-rate sensitivity, while the historical level of yield curve inversion argues for staying away from the long end. Recent positive economic surprises in the US, analysis and recent deterioration in liquidity could also argue for further upward pressure on long-term yields.


Credit
ATTRACTIVE

Despite the recent tightening of spreads, the risk/reward remains attractive due to the high level of carry and lower rate volatilityexpectations. While we were already positive on the front end of the credit yield curve, we are moving to longer investments in the 5-10 year segments.

EM
CAUTIOUS

Emerging market bonds have rallied impressively, outperforming investment grade US corporate bonds by more than 5% over the past six months. But rising idiosyncratic risks and the tight premium to investment grade bonds make us tactically cautious.


The contrarian view: 
subordinated debt!
POSITIVE

One of our favorite fixed income segments, offering attractive valuation (in relative terms) despite the recent rally. The sector continues to benefit from strong capital position, low non-performing loan ratios and balance sheets that remains well provisioned.


The Chart of the week:

Highest yield for German 10 year bonds since 2011!

Picture8

Source: Bloomberg

The yield on the German 10-year bond rose to 2.58%, its highest level since 2011, just as core CPI in the eurozone hit a new record high of 5.3%. The European Central Bank must again work hard to bring inflation expectations back to their 2% target.

Disclaimer

This marketing document has been issued by Bank Syz Ltd. It is not intended for distribution to, publication, provision or use by individuals or legal entities that are citizens of or reside in a state, country or jurisdiction in which applicable laws and regulations prohibit its distribution, publication, provision or use. It is not directed to any person or entity to whom it would be illegal to send such marketing material. This document is intended for informational purposes only and should not be construed as an offer, solicitation or recommendation for the subscription, purchase, sale or safekeeping of any security or financial instrument or for the engagement in any other transaction, as the provision of any investment advice or service, or as a contractual document. Nothing in this document constitutes an investment, legal, tax or accounting advice or a representation that any investment or strategy is suitable or appropriate for an investor's particular and individual circumstances, nor does it constitute a personalized investment advice for any investor. This document reflects the information, opinions and comments of Bank Syz Ltd. as of the date of its publication, which are subject to change without notice. The opinions and comments of the authors in this document reflect their current views and may not coincide with those of other Syz Group entities or third parties, which may have reached different conclusions. The market valuations, terms and calculations contained herein are estimates only. The information provided comes from sources deemed reliable, but Bank Syz Ltd. does not guarantee its completeness, accuracy, reliability and actuality. Past performance gives no indication of nor guarantees current or future results. Bank Syz Ltd. accepts no liability for any loss arising from the use of this document.

Read More

Straight from the Desk

Syz the moment

Live feeds, charts, breaking stories, all day long.

Thinking out loud

Sign up for our weekly email highlighting the most popular posts.

Follow us

Thinking out loud

Investing with intelligence

Our latest research, commentary and market outlooks