

.png)
STORY 1 —
Invasion of Ukraine
This is without doubt the most dramatic and important development of the first quarter. Although a Russian incursion into Ukraine appeared plausible at the beginning of the year, Russian President Vladimir Putin's decision to carry out a full-scale war beyond the separatist region of Donbass has stunned the world. Beyond the human tragedy of the conflict, the sanctions imposed by the West on Russia have far-reaching consequences for the global economy and monetary order. This episode of history comes at a time when the supply of raw materials is already insufficient to meet demand. Meanwhile, Russia produces and exports the vast majority of them: oil, natural gas, industrial metals,precious metals, agricultural commodities, etc. The global economy is therefore facing a commodity supply shock, with consequences on both growth (downside risk) and inflation (upside risk). At the time of writing, a rapid end to the war, and therefore to the application of sanctions, seems unlikely. Even if an agreement is reached, the normalization of relations between Russia and the West could take years, as long as Putin remains in power.
STORY 2 —
Stagflation fears
From a macroeconomic standpoint, global GDP continues to rise above trend but forecasts for 2022 are being revised downward. Meanwhile, inflation keeps surprising on the upside, hitting multiple decade highs across the globe. U.S. consumer price jumped 7.9% from a year earlier in February to a fresh 40-year high on rising gasoline, food and housing costs, with inflation poised to rise even further following Russia’s invasion of Ukraine. In Europe, Germany's inflation jumped by 7.3% in March, the highest CPI YoY print since November 1981. While the conflict's immediate impact on the world economy is expected to be limited (Russia's economy accounts for less than 2% of global GDP), rising commodity prices could fuel greater or at least more persistent inflation, eating into household wages. This has led to rising stagflation fears.
World GDP forecast (orange line) and World Economic Weighted Inflation
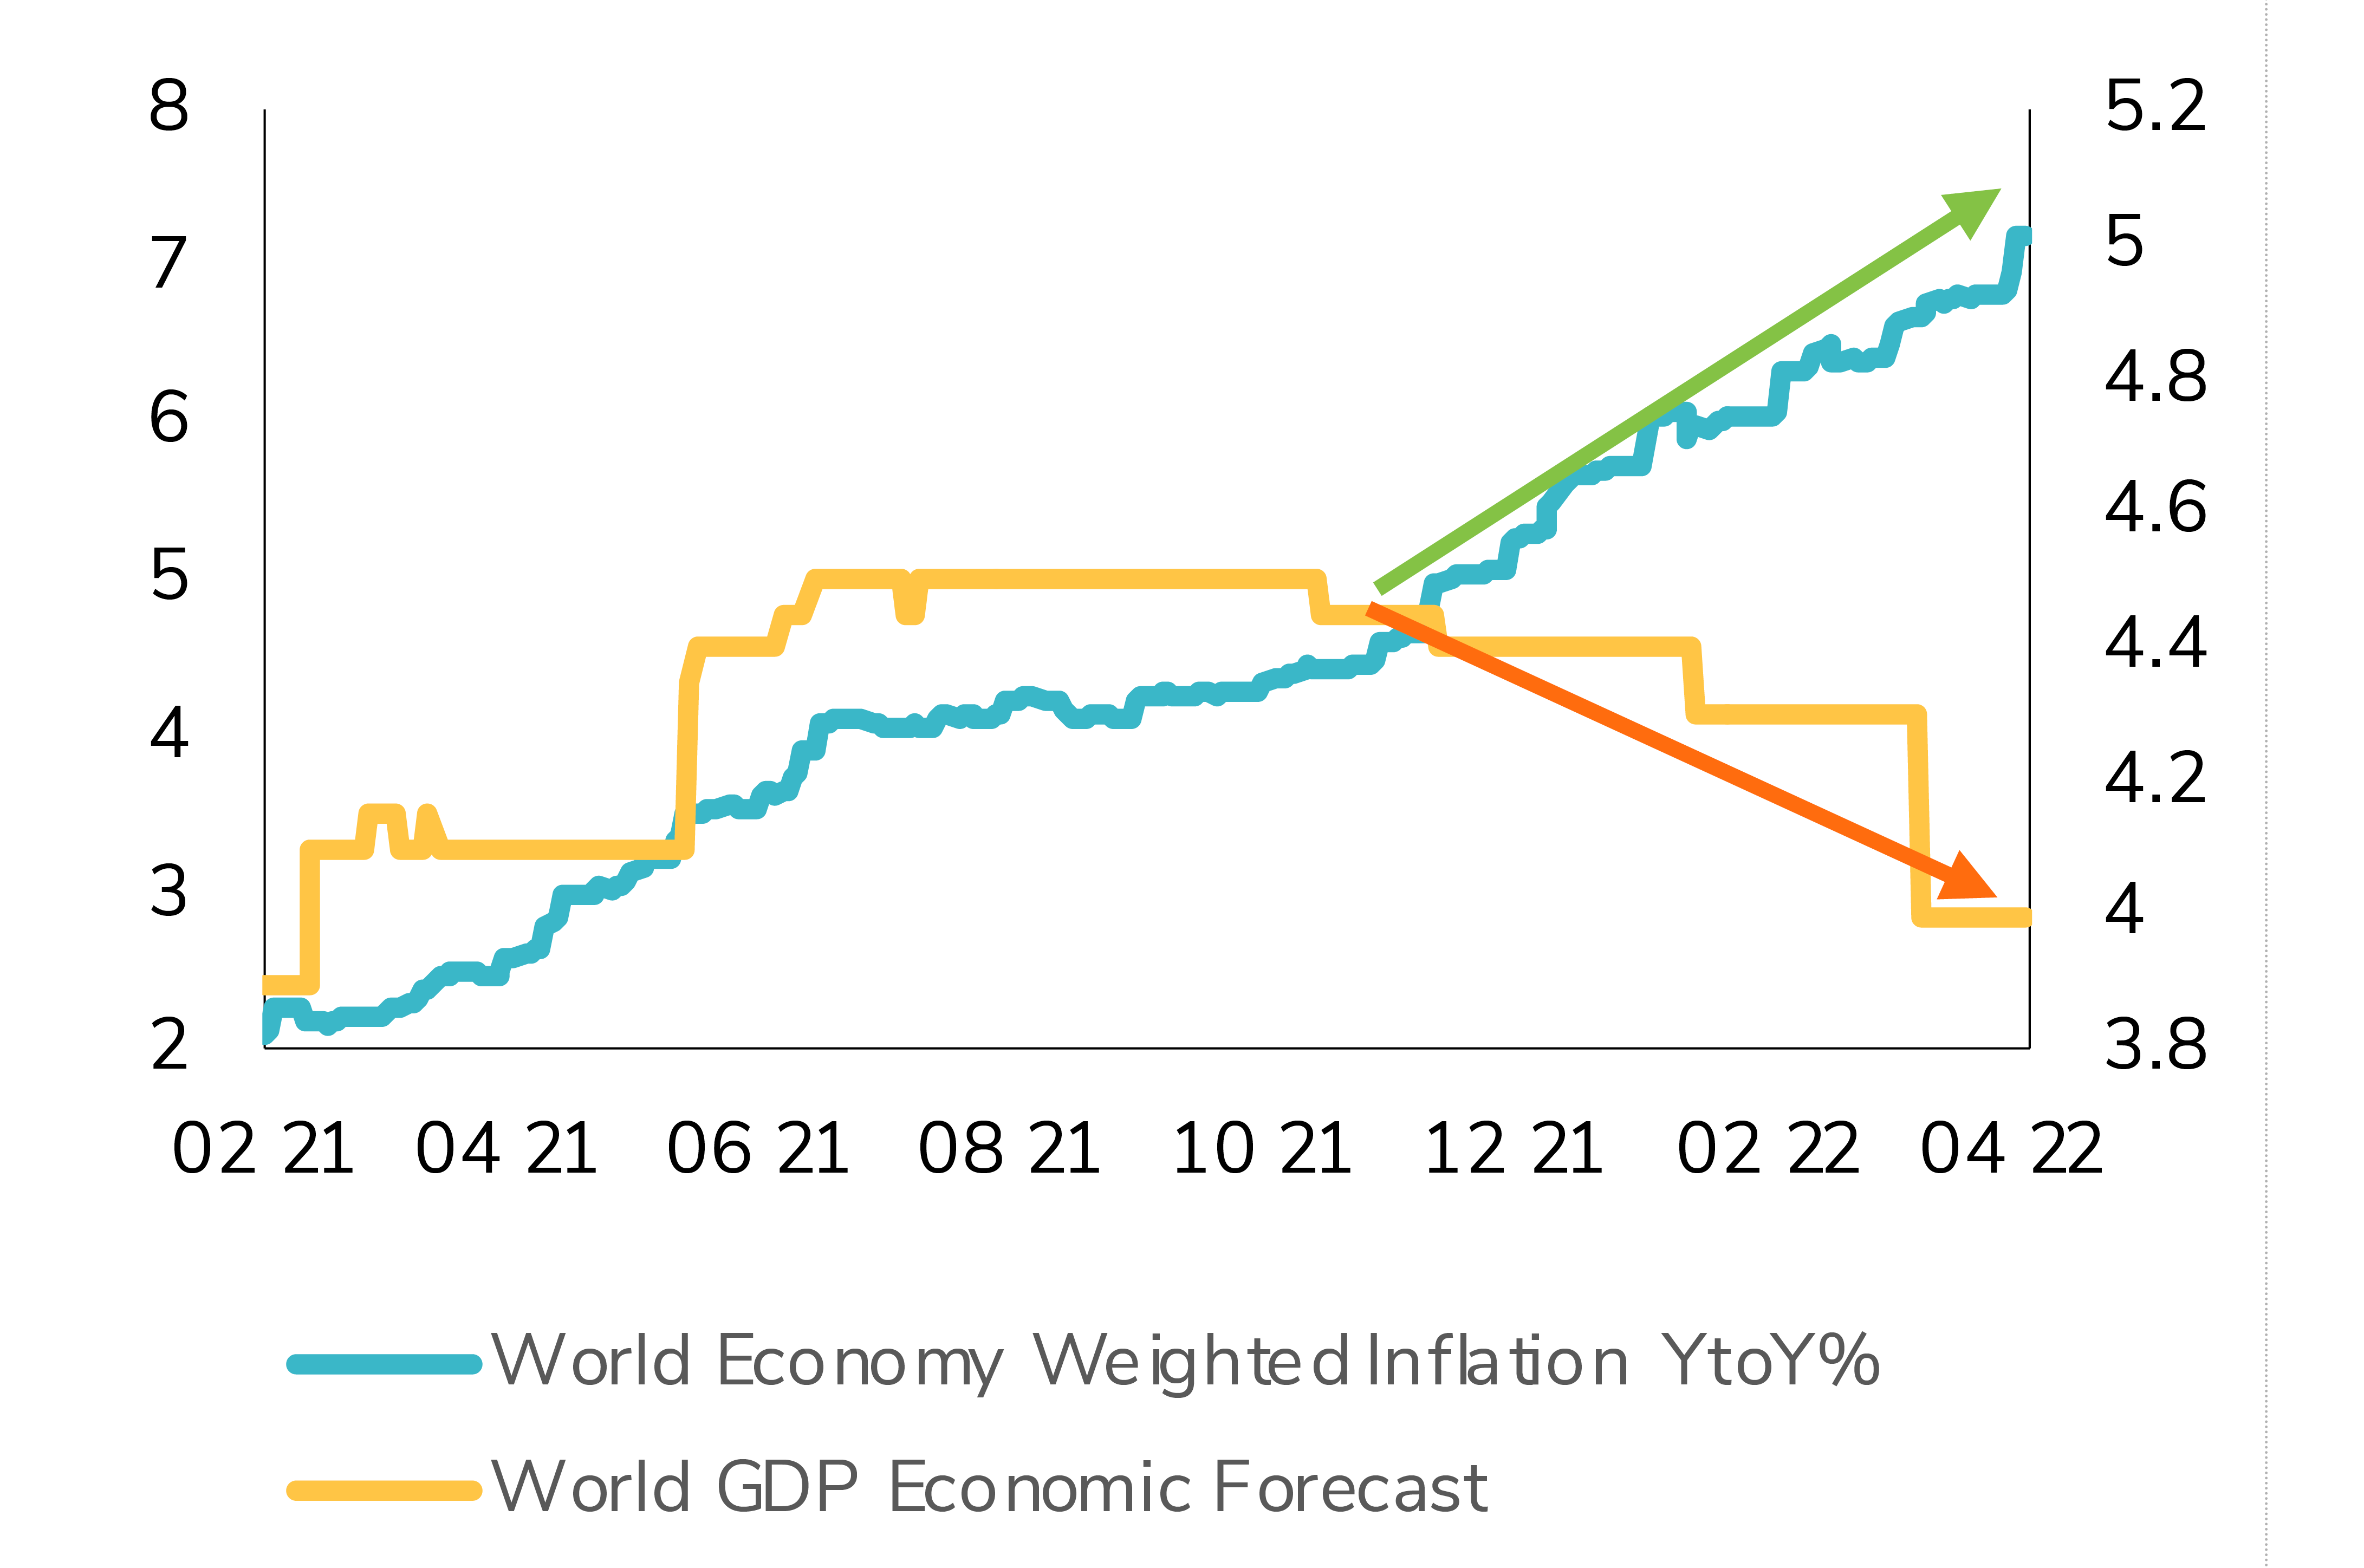
Source: Bloomberg
STORY 3 —
The start of a rate cycle by the Fed
On the 16th of March, the Fed's FOMC tightened interest rates for the first time since December 2018. While Chairman Jerome Powell initially called the post-vaccine inflationary pressure “transitory”, Fed officials have moved away from that stance and are set to follow central bank peers, like the Bank of England, with multiple rate hikes in 2022. The US continue to face strong rents and wages inflation. In the meantime, sanctions on Russia have led to additional upward pressures on commodity prices, which are likely to push inflation rates to even higher levels. Sanctions and renewed Covid cases in China could both lead to additional supply chain bottlenecks. Investors have been adjusting their expectations accordingly, pricing in a fast and brutal rate hike cycle in the short-term with potential negative consequences on growth (and thus rates) later on. At the short-end of the yield curve, we saw an unprecedented divergence as the market is now pricing in 9 rates hikes in 2022 (vs. 2 hikes a few montsh ago) and 3 rates cuts in 2023/2024 (versus 2 hikes a few months ago).
FOMC rates expectations in 2022 (blue line) vs. 2023/2024 rate expectations (yellow line)
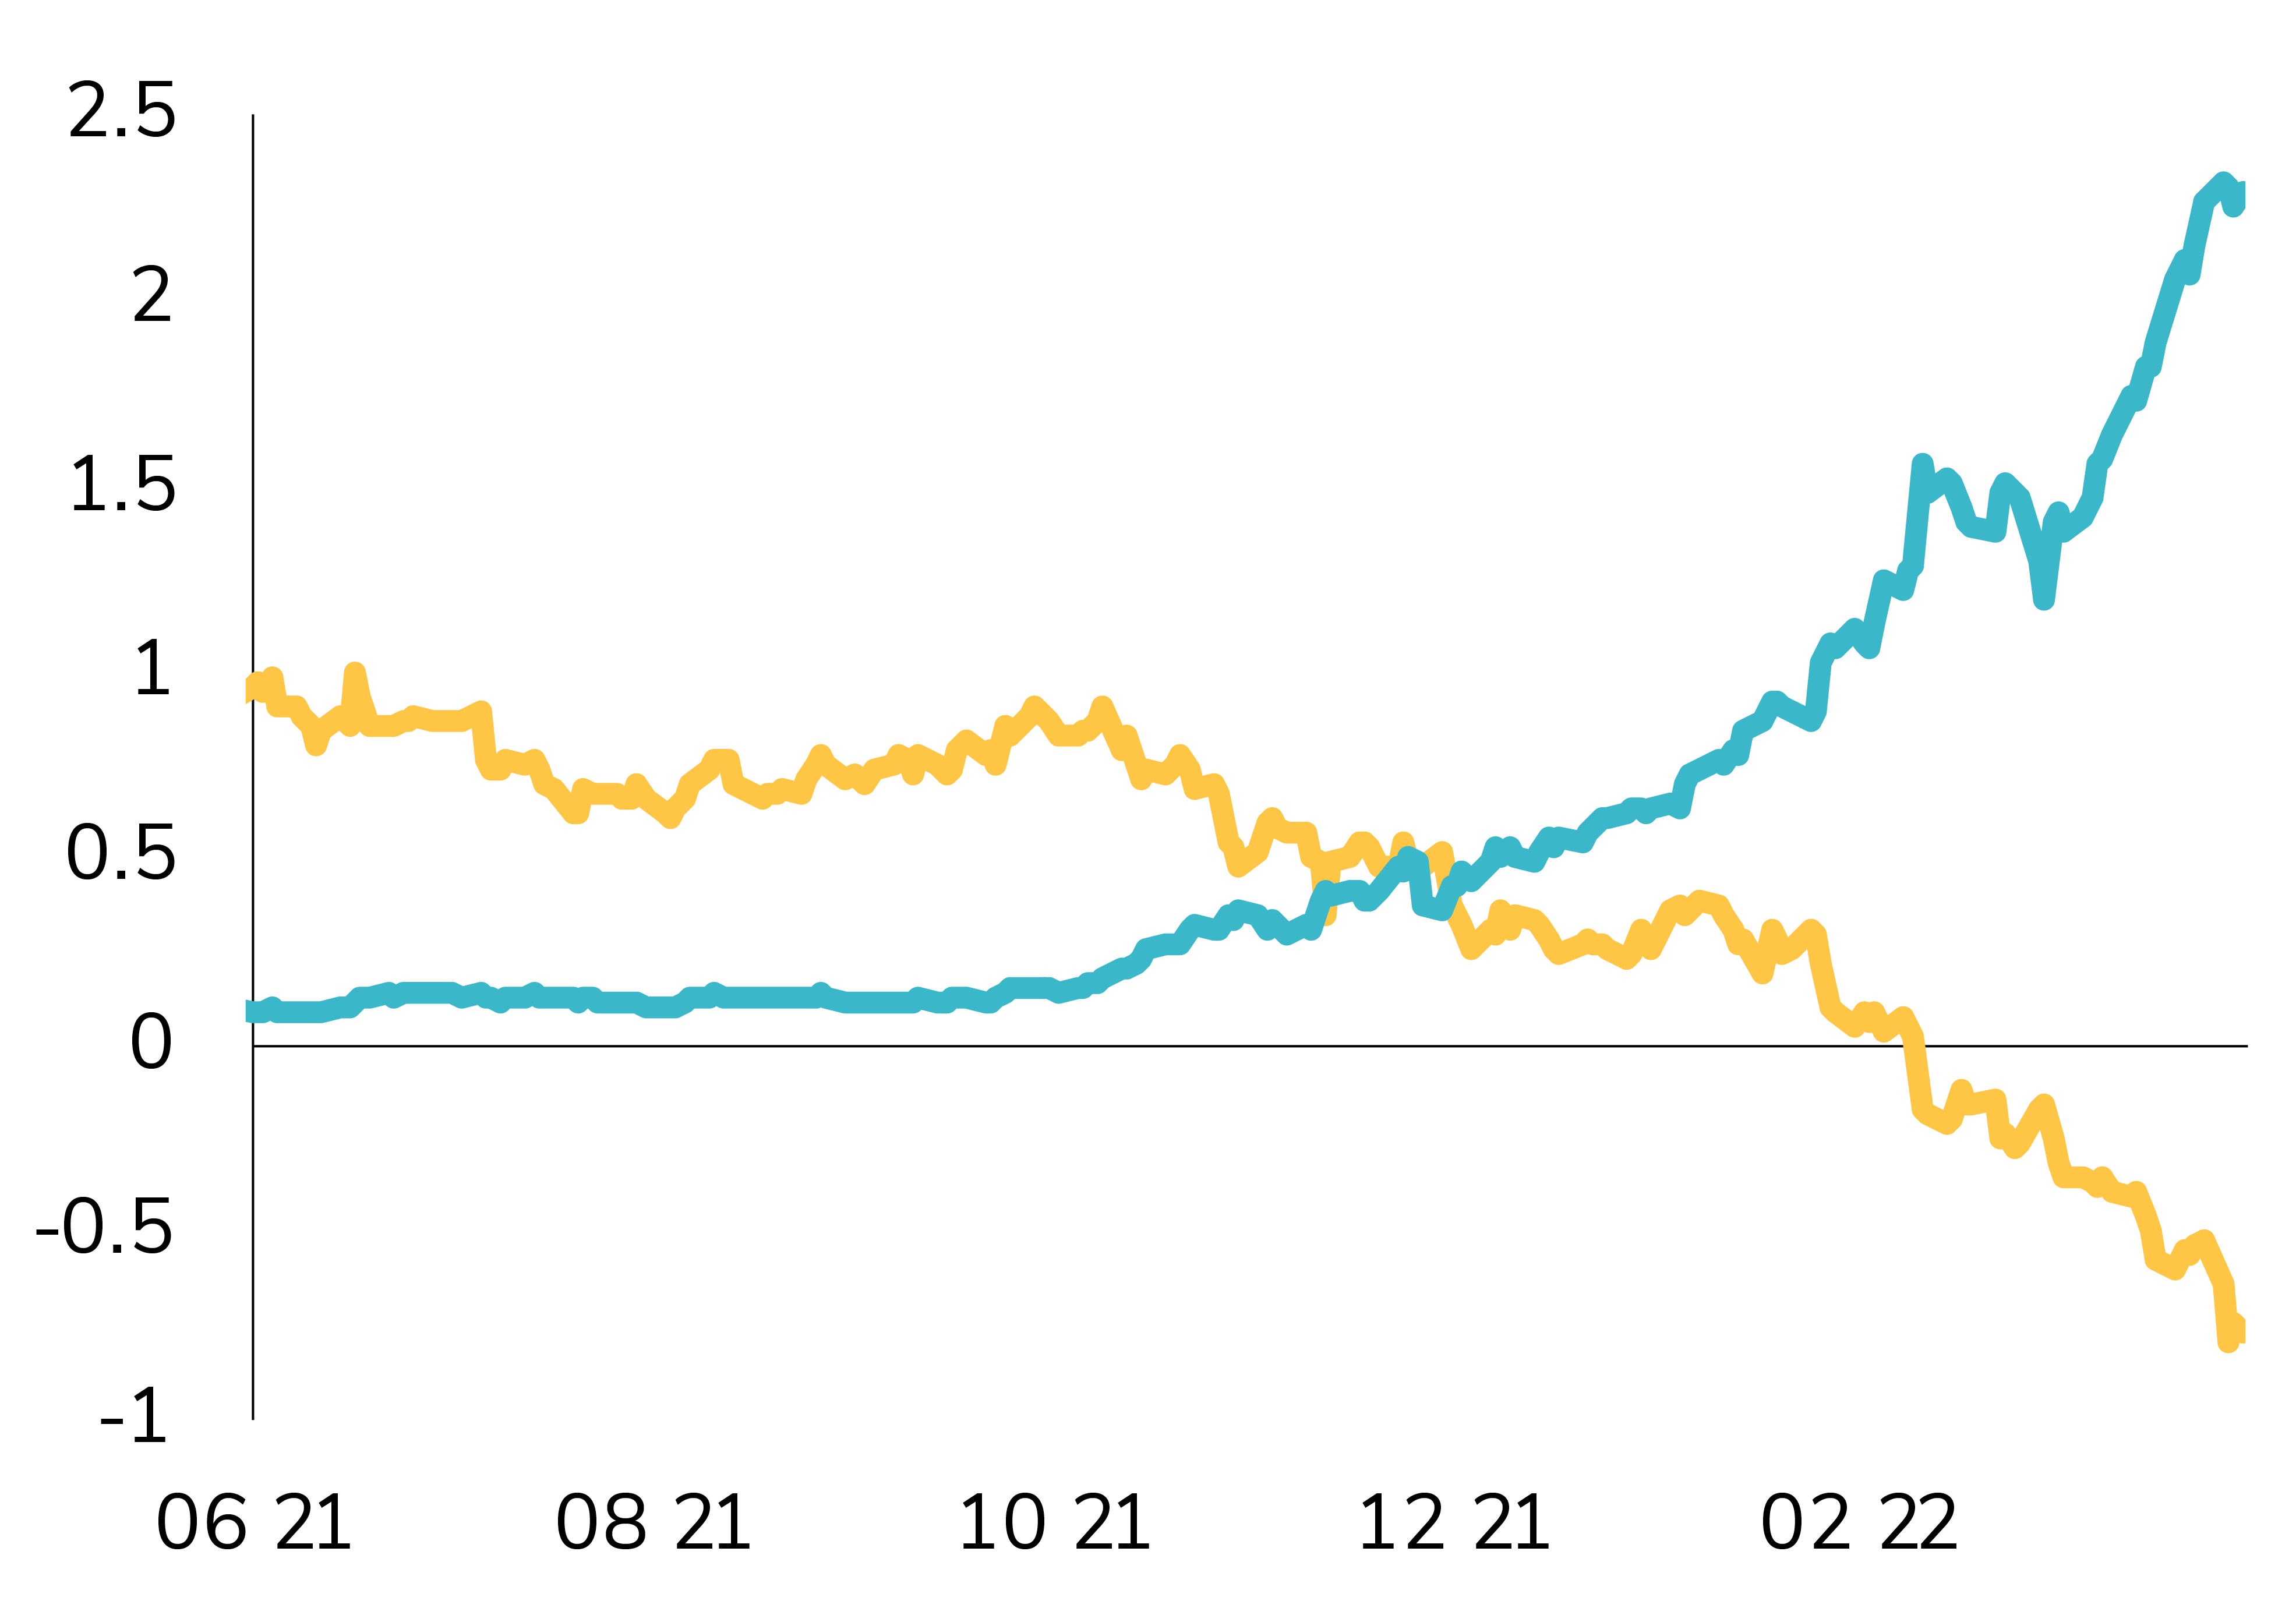
Source: Bloomberg
STORY 4 —
Resilient corporates and consumers
Despite all these negative headlines (war, inflation, etc.), there are some bright spots including two areas of relative strength in the U.S. economy. First, the U.S. consumer remains healthy: unemployment rate fell to 3.6% -- a post- pandemic low – and average hourly earnings are increasing at a solid pace (+5.6% year-over-year). U.S. households overall are entering the year with over $2.5 trillion more in savings than before the pandemic began, which offers some cushion in the face of rising borrowing costs. On the corporate side, balance sheets and earnings growth have been resilient: we continue to see earnings revisions for 2022 edging higher. Typically, analysts revise their earnings growth expectations downward for the year in the face of the events we saw in Q1. But we have not seen this trend yet. Expectations for S&P 500 earnings growth are now at 9.1%, up from 7.0% at the end of last year.
S&P 500, 2022 EPS Forecasts ($)
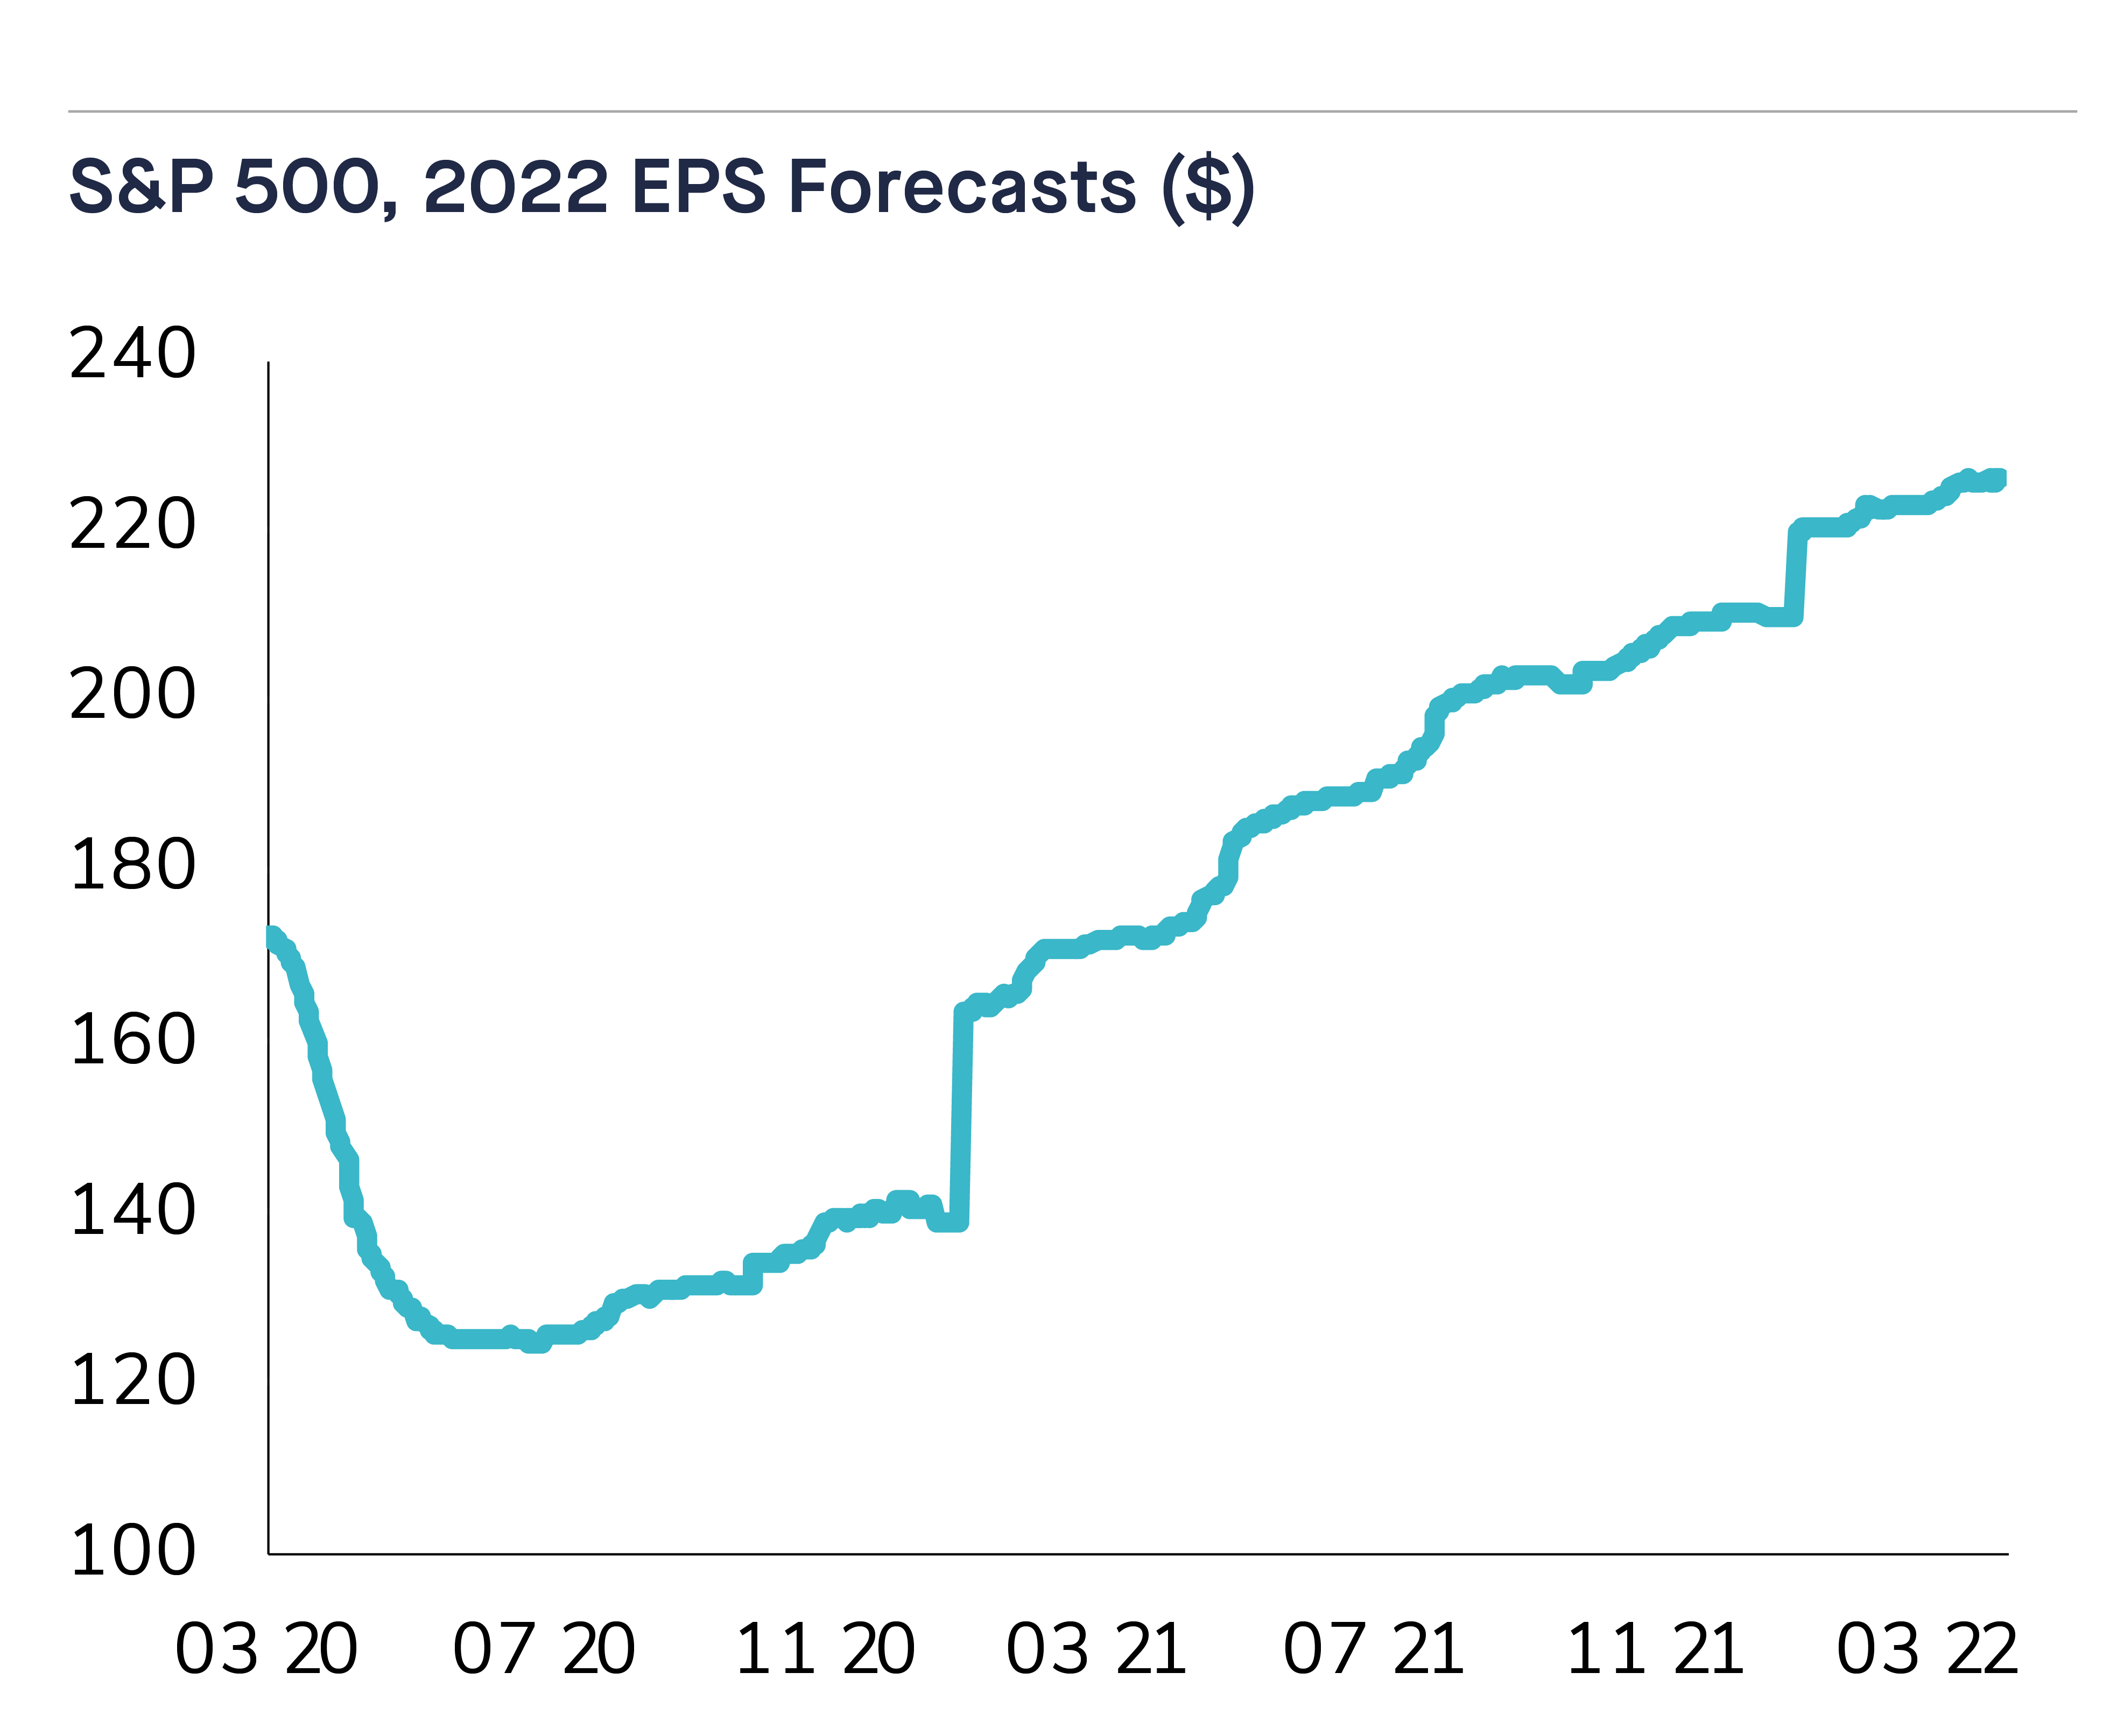
Source: Edward Jones
STORY 5 —
Nowhere to hide for multi-asset investing
Across equity & fixed-income markets broadly, the ‘least- bad’ quarterly performance among US assets were declines of 4.9% (price return) in S&P 500. They were followed by a 5.6% fall in Treasuries. A model portfolio made of 60% US equities / 40% Aggregate US bonds recorded its 1st quarterly loss in 2 years. With the exception of commodities (see next story), there was no place to hide for investors. European equities were hit by the Russia-Ukraine conflict as the MSCI Europe ex-UK is down -8.1% over the quarter. Europe is a huge importer of oil and natural gas from Russia, which makes the area highly vulnerable to the sanctions. Despite some bright spots (see story 8), the MSCI Emerging Markets index also recorded a quarterly decline (-6.9%). A new round of Omicron cases and lockdowns in China weighed on Chinese markets on top of the broader geopolitical concerns. Japan is down -1.2% over the quarter.
Stock and bond investors just had their toughest quarter in decades
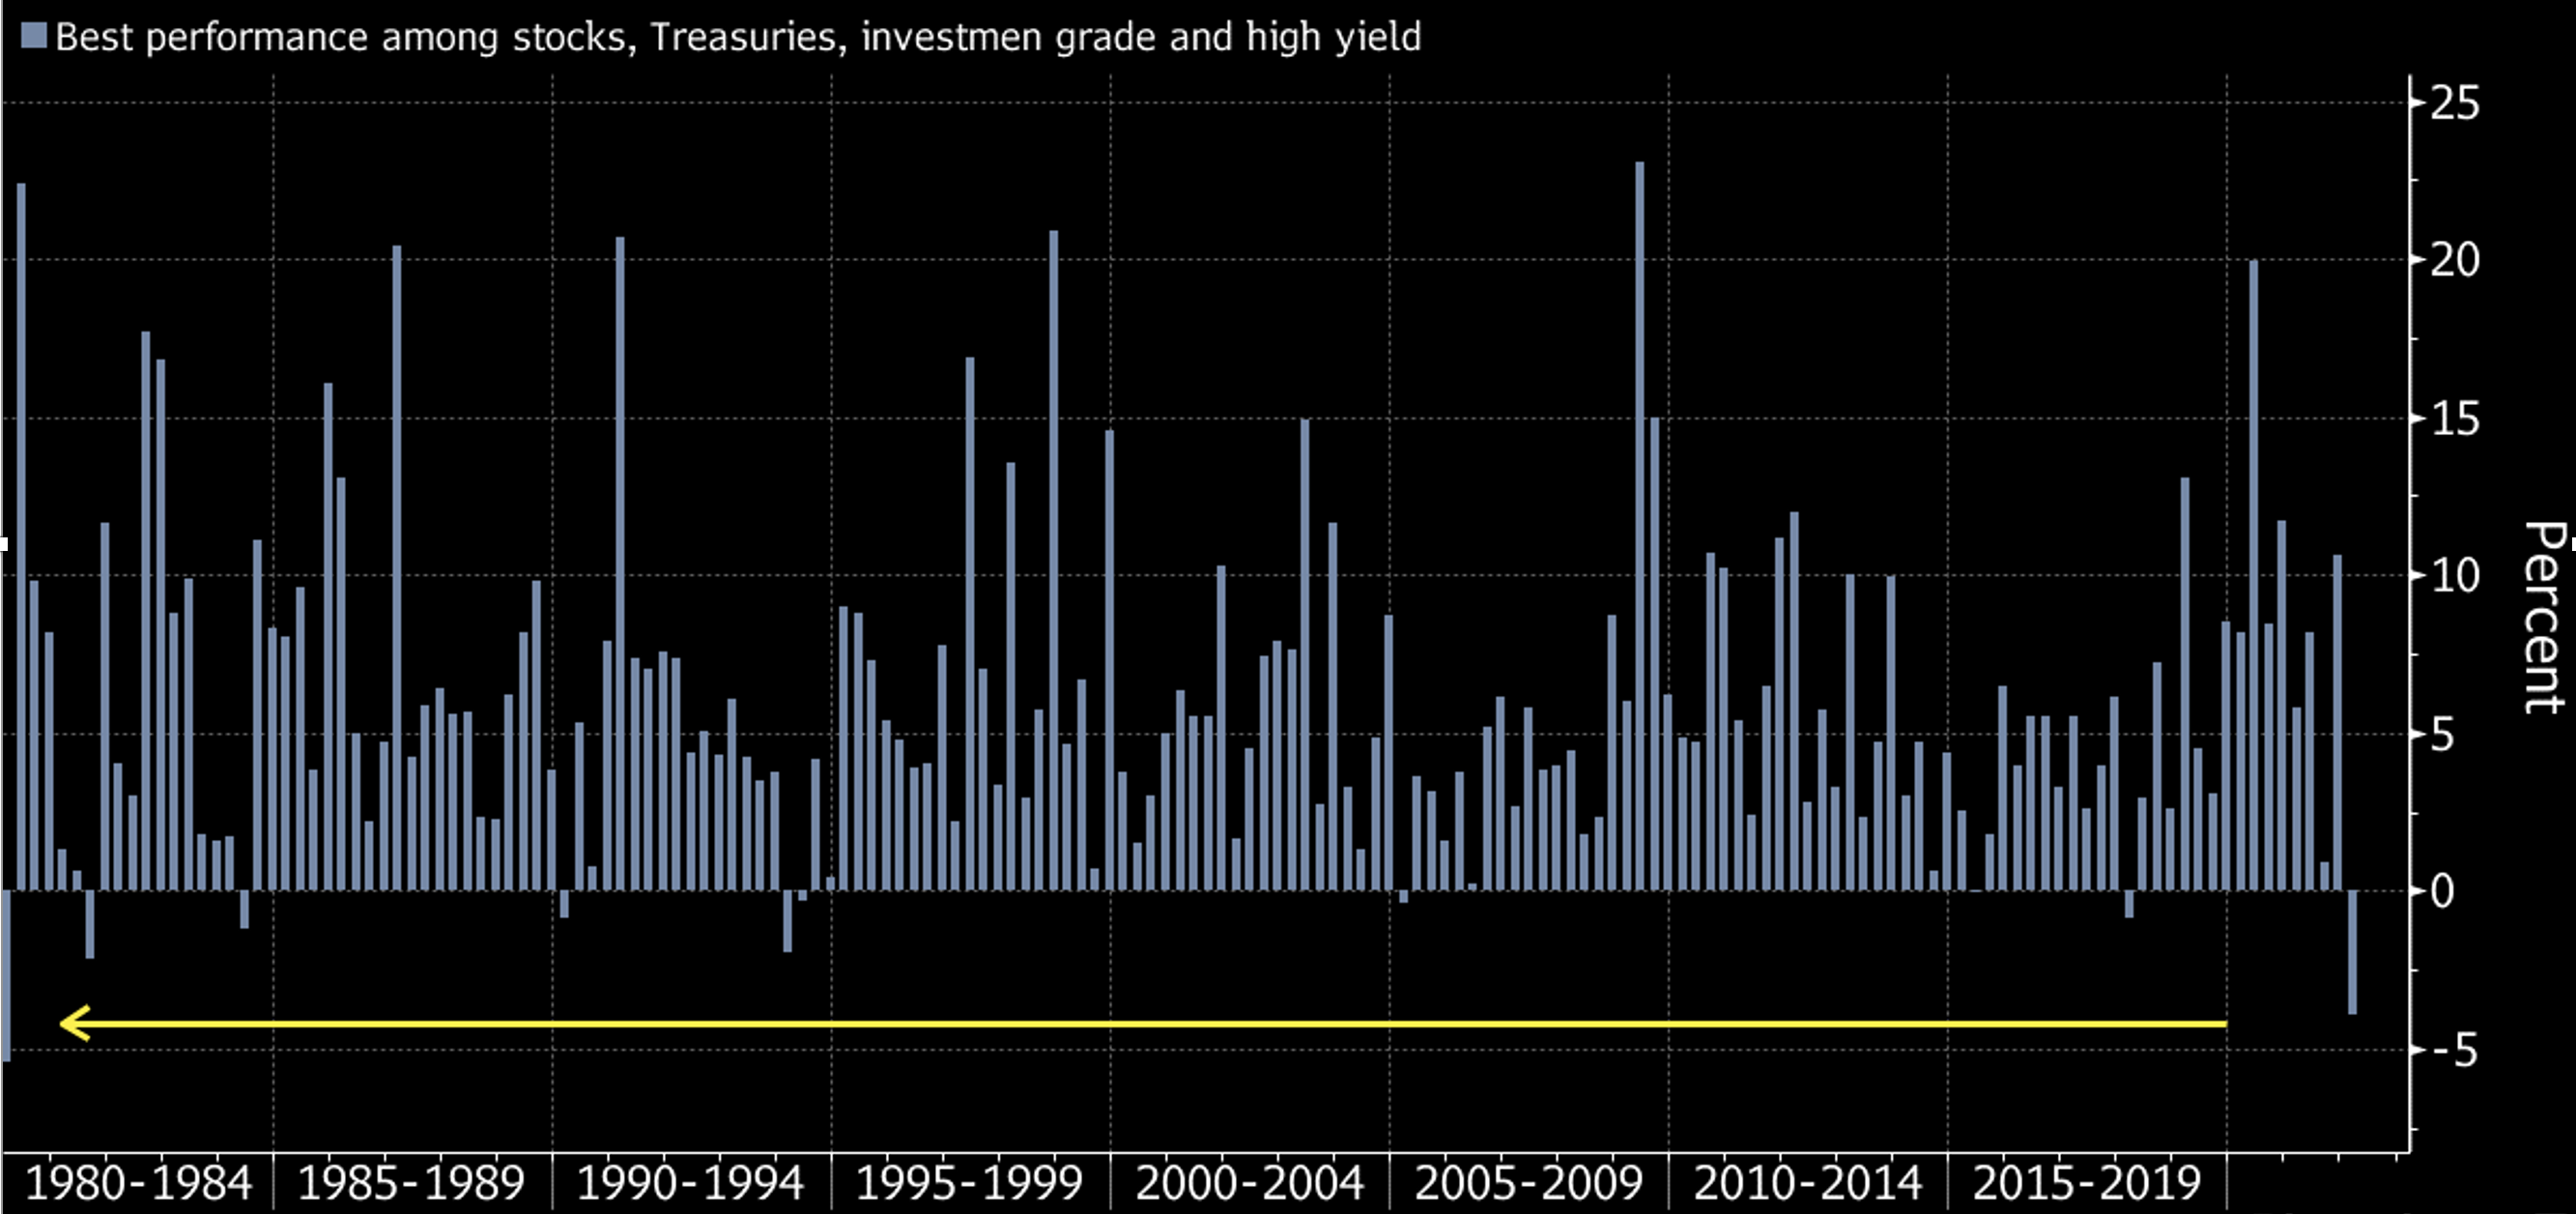
Source: Bloomberg
STORY 6 —
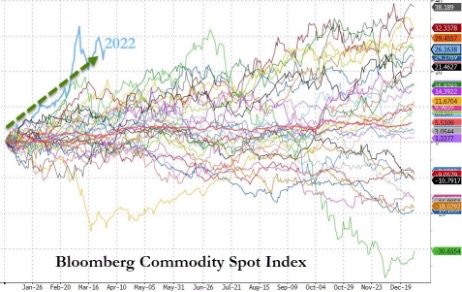
Best to start to a year ever for Commodities
Commodities were all up in Q1 with Bloomberg's Commodity Spot Index having its best start to a year ever, up 26% in Q1. Oil was the standout for many, with WTI up around 40% - which is oil's best start to a year since 1999. US Natural Gas soared to its best start to a year since 1990 but European Natural Gas spiked even higher. Copper and Precious metals rose around 6% in Q1. This was gold's best start to a year since 2016 as the yellow metal was seen by many investors as one of the few remaining “safe havens”. Russia is a major commodity exporter, accounting for 13% of global crude oil production and 17% of global natural gas production. Russia accounts for nearly a fifth of the world’s wheat exports, together with Ukraine. As a result, an interruption in the supply of energy and other agricultural goods creates a significant upside risk for Commodities.
Bloomberg Commodity Spot Index yearly performance
Source: Bloomberg
STORY 7 —
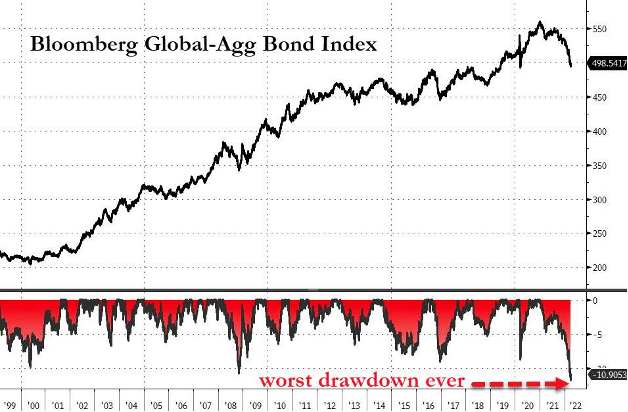
Greatest drawdown on record for global bonds
Based on Bloomberg's data, the global bond market just suffered its greatest drawdown on record. Indeed, the Bloomberg Global Aggregate Bond index is down -6.2% over the quarter. US Treasuries are down -5.6%. Since the US Civil War, the 10-year US Treasuries have only seen a worse total return quarter in the early 1980s and in Q4 1931 after the peak of the Depression-based rally. In Q1, US 2Y yields soared 156bps while the long-end also rose by 'just' 55bps. This was the biggest flattening to start a year ever. From a sub-sector point of view, Inflation-linked (-4.4%) and US High Yield (-4.5%) outperformed the Aggregate index. Euro Government bonds were down -5.3% while Emerging Markets debt were down -9.3%.
Bloomberg Global Aggregate Bond Index & drawdowns
Source: Bloomberg
STORY 8 —
2nd worst start to a year for US stocks since 2008
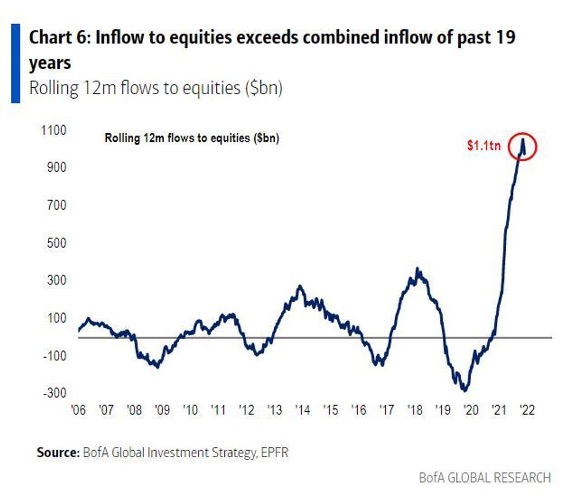
Most major equity markets ended the first quarter of 2022 lower, with the S&P 500 down about -5.0% (total return -3.4%), while the Nasdaq ended down around 8%. This is the 2nd worst start to a year for stocks still since 2008 (only the COVID crash was worse). March was a bit of a bright spot, however, as the major averages enjoyed a solid two-week rally during the second half of the month. Nasdaq rallied a stunning 17% off the mid-March lows (in 10 days) and the S&P was up almost 12% during the same period, thanks to a massive short squeeze. We note the great rotation between fixed income funds and equity funds is finally underway as investors believe that stocks are a much better hedge against inflation than bonds. As such, fixed income funds suffered major outflows in Q1 (-$80bn) while equity funds recorded inflows despite the negative news flow (war, inflation, Fed, etc.).
Inflow to equities exceeds combined inflow of past 19 years
Source: BofA Global Investment Strategy, EPFR
STORY 9 —
Commodity-related equity markets and sectors thrived
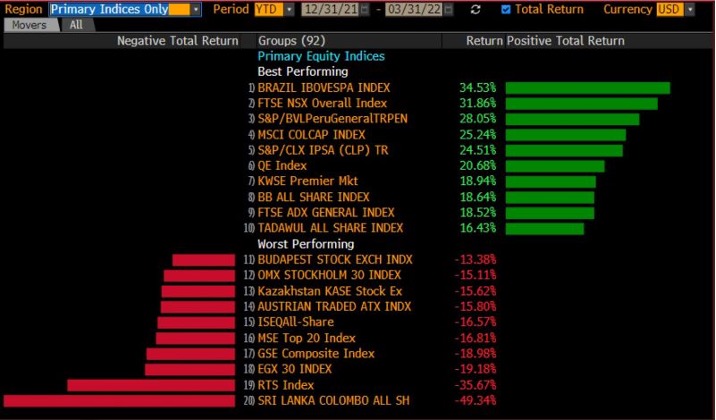
From a sector standpoint, Energy stocks (+39%) were Q1's massive winner with Utilities the only other sector to end in the green. Communication Services (-11.2%), Consumer Discretionary (-9.4%) and Tech (-8.4%) were the quarter's biggest laggards. Over the quarter, developed market value stocks were only down 0.5% while growth stocks fell nearly 10% on the back of rising bond yields. We note however that growth stocks started to outperform in March as Mega- Cap tech stocks rebounded massively in late-March (but still remain lower in Q1). From a country standpoint, stock markets from commodity-rich countries such as Brazil, Peru & the Saudi Arabia were the main beneficiaries last quarter. Russia's stock exchange was the 2nd weakest with a drop of 36%. Sri Lanka fared even worse, with its stock market nearly halving in dollar terms.
Best and worst performing stock markets in Q1
Source: Bloomberg
STORY 10 —
Strong dollar and a volatile quarter for cryptos
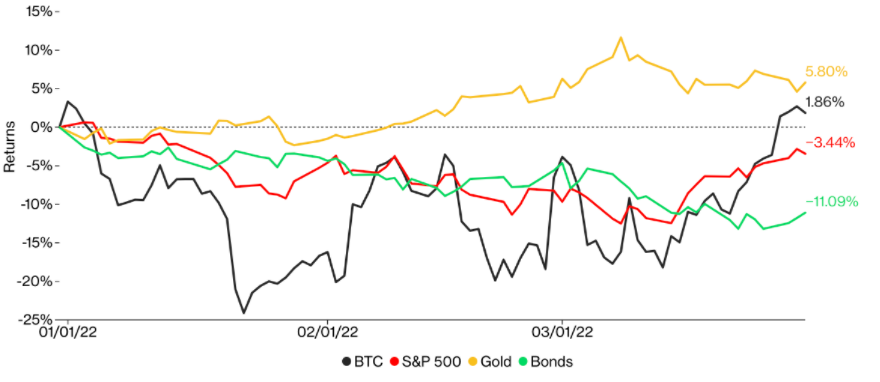
The dollar was higher in Q1, trading back into the pre- COVID range and to its highest monthly close since July 2020. Expectations for faster monetary tightening in the US contributed to a rally in the dollar, which finished the quarter up about 3% against both the pound and the euro. FX markets once again reflect the rise and fall of nations. The Ruble is down -9% over the quarter but is not the weakest currency year-to-date as the Turkish Lira did even worse (almost -10%). Brazil Real (+17.6%) and South-Africa Rand (+9%) appreciated on the back of strong commodity markets. Cryptocurrencies had a tough Q1. Bitcoin had one of its worst-ever starts to a year trading as low as $34,000 in February. But thanks to a strong recovery in the last part of the quarter, Bitcoin performance is almost unchanged over the quarter. Note that the correlation between bitcoin and the S&P 500 hit its highest level ever (nearly 0.9). Despite a strong performance in March Ethereum is down over 10% in Q1.
Selected asset class returns in Q1
Source: Coindesk