
.png)
The big picture
with fears of a hard landing as central banks had no other choice but to implement the most aggressive monetary policy tightening since the 80s. In 2023, the global economic context looks very different. Last week CPI and PPI numbers in the US provided another batch of positive surprises for investors. Indeed, US inflation eased further in June with core and headline CPI coming in each at 0.2% MoM (vs. 0.3% expected). Headline CPI slowed to 3% YoY vs 3.1% expected (and lowest since March 2021) while core CPI dropped to 4.8% YoY vs 5% expected. This was the 12th straight month of YoY declines in headline CPI - equalling the longest streak of declines in history (since 1921).
US PPI number seems to indicate there is more disinflation ahead: US PPI slowed to 0.1% YoY in June, from 0.9% in May and lower than expected. This is the slowest pace since August 2020 and is down from the all-time high of 11.7% YoY from March 2022 in a promising sign for CPI.
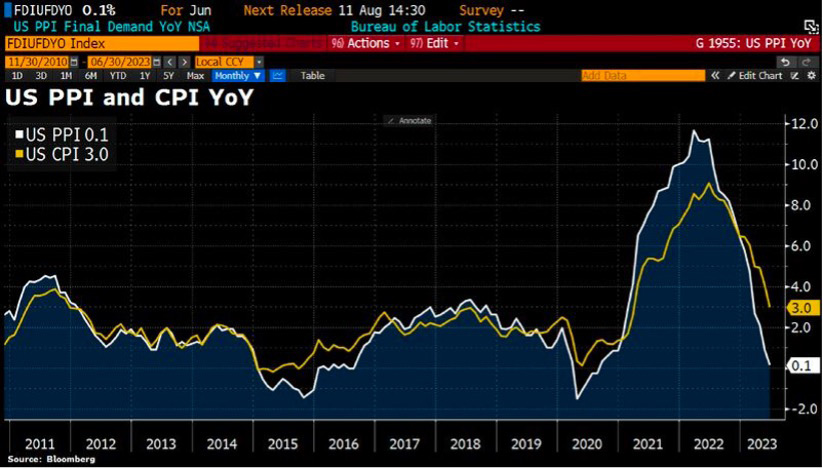
Source: Bloomberg
The spread between YoY CPI and PPI remains at the widest levels since the current incarnation of PPI started in 2011. This is a good omen for corporate America as the spread between US CPI and PPI is key to support profit margins. Companies are able to boost the prices they charge consumers more and more relative to their input cost.
Meanwhile, both hard and soft macro data continue to surprise on the upside. For instance, US consumer sentiment is now at its highest level since September 2021 on the back of falling inflation, continued strength in employment and a booming stock market. Wall Street is progressively shying away from the recession scenario; a “soft landing” becoming the new consensus. Indeed, with inflation cooling down, markets hope that the Fed might not be forced to engineer a recession. The latest US GDP forecasts now anticipate a very tiny technical recession in the second half of this year and a smooth recovery in H1 2024.
Thanks to this “goldilocks scenario”, the S&P 500 is up +17.5% year-to-date, which is the 2nd best start of the year over the last two decades (only 2019 was stronger). So far, the S&P 500 is not following the path of previous prolonged bear markets (2000-2002 and 2007-2009). It has also led to a new acronym (courtesy of Goldman): the “Recession In Name Only” (R.I.N.O) rally. Wall Street sentiment has shifted from fear to greed in a matter of months and the VIX (“fear index”) now trades at 13, which illustrates how complacent investors are.
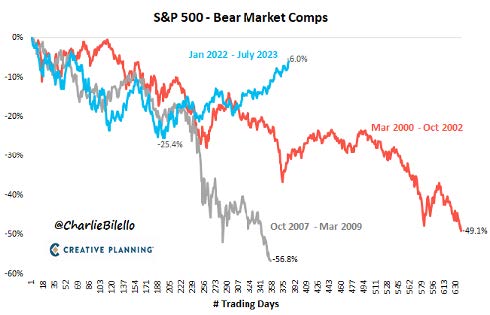
Source: Charlie Bilello
The tightness of credit spreads (less than 130 basis points for US Investment Grade bonds and less than 400 basis points for High Yield) is another reflection of investors’ pricing in a soft landing scenario.
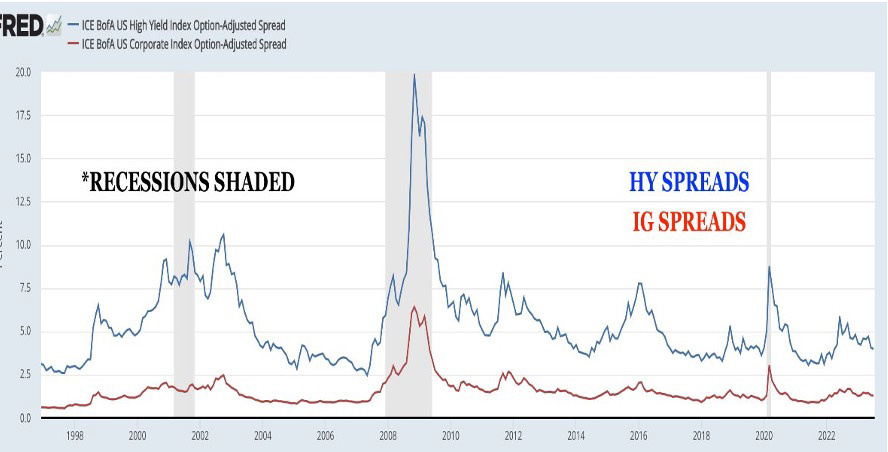
Source: FRED
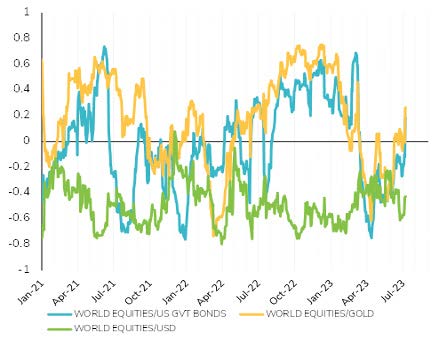
Meanwhile, US and global sovereign bond yields seem to have peaked as well, as investors anticipate lower growth and less inflationary pressure ahead. The easing of yields has been supportive for long duration stocks such as the mega-cap tech. On the other hand, it continues to weigh on the dollar which has been depreciating against all G10 currencies with the exception of the Japanese Yen and the Norwegian Krone.
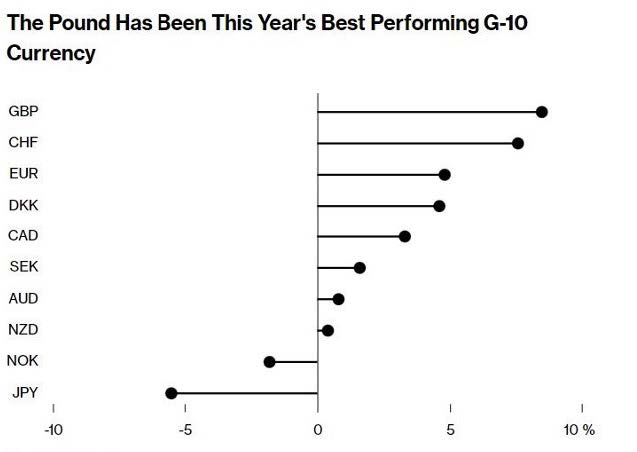
Source: Bloomberg
So, what’s next?
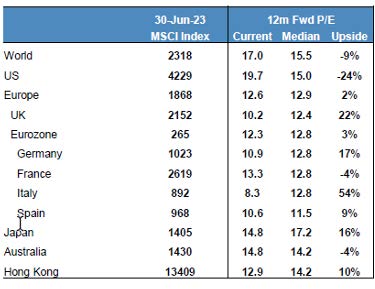
After a strong first half of the year, the outlook for global equities is mixed. On the positive side, the fact that the end of the rate hike cycle in the US could be near is definitely a tailwind for risk assets – although we would stress out that liquidity conditions remain unfavourable (Quantitative Tightening is still ongoing on both sides of the Atlantic). Earnings have proved to be more resilient than expected. Nominal GDP growth is boosting companies “top-line” and “greedflation” have been so far supporting corporate margins. The fact that the dollar is weakening should help US exporters while positive real wage growth is a positive for more domestically focus US stocks. From a valuation perspective, the “Magnificent Seven” are indeed richly valued. But other parts of the markets (e.g US Value and small-caps, international stocks) trade on reasonable P/E multiples. From a technical perspective, the trend remains positive and participation to the upside (market breadth) has been improving recently. Sentiment is getting even more bullish which is a rather negative signal from a contrarian perspective. We note however that global fund flows have been directed towards bonds and cash recently rather than into equities. This means there is a lot of dry powder on the side line to be reinvested into risk assets.
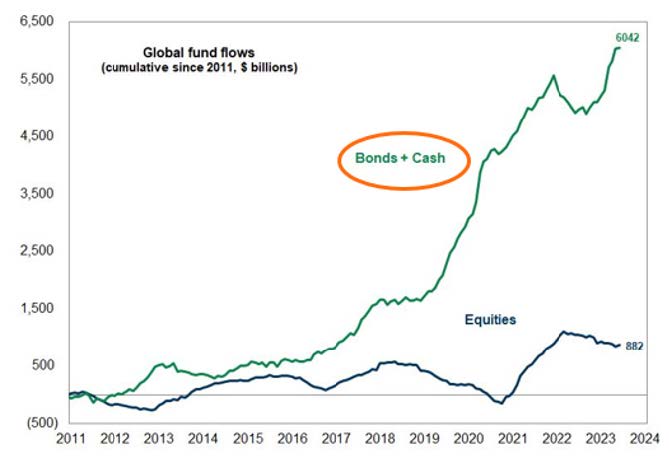
Source: Goldman Sachs
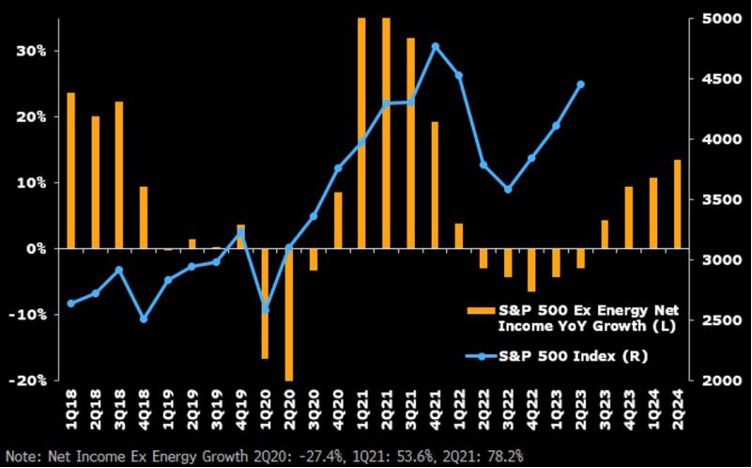
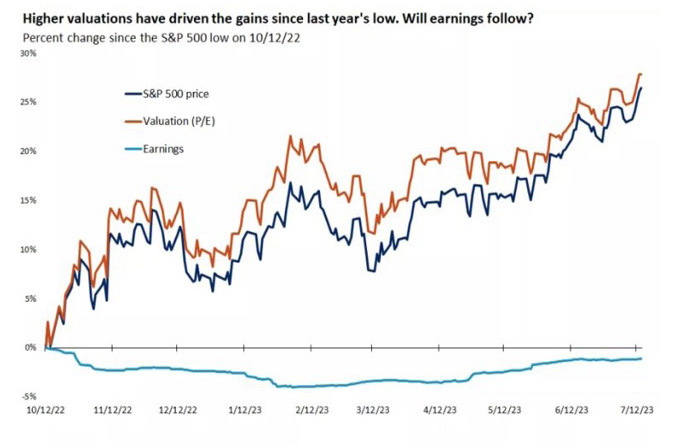
On the negative side, we note that the S&P 500's 25% gain since last year's low has been driven by valuation expansion rather than rising earnings. This implies two things: 1) Valuations are currently stretched (almost 20x next year’s earnings for the S&P 500); 2) Earnings expectations need to at least be met, which is not a given as the economy is still expected to slow down in the coming quarters.
From a macro perspective, we also believe it is too soon to declare victory on disinflation and a soft-landing. First, the US labour market remains too hot with demand still outstripping supply by a large margin. This means that wage growth is likely to put upward pressure on US inflation and prevent the core CPI to move close enough to the Fed’s target in the near future. As the year-ago comparisons become tougher, the improvement in the headline inflation could stall. Energy (OPEC+ supply cuts) and Food (see latest move by Russia to weaponize Wheat) could also be the wild cards for H2 2023. Second, the lag between a significant tightening of financial conditions and the start of a recession is famously long and variable. And there are signs that some interest-rate sensitive parts of the US economy are already getting hurt. Bankruptcy filings by larger corporations in the first half of this year rose to the highest level since the same period in 2010, when they were coming down from the Financial Crisis. Meanwhile, US banks are showing a growing willingness to rework the terms of U.S. commercial real estate loans to prevent defaults, mitigating near-term losses but also masking growing stress in some parts of the market.
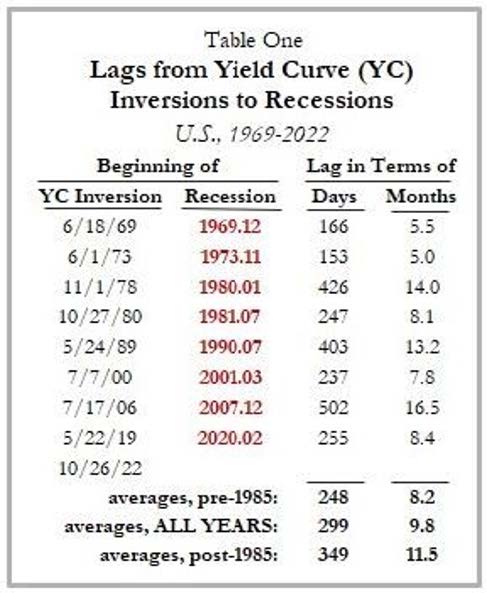
In the past, the inversion of the yield curve proved to be a reliable leading indicator of an upcoming recession. While the yield curve has provided a false signal in the current cycle, we also need to keep in mind there is always a lag between the start of the yield curve inversion and the start of a recession - see table below. Actually, it is when the curve starts to steepen that the recession finally takes place (if history is any guide). Based on the average time lag shown below (average of 10-11 months between starts of inversion and start of a recession), the jury is still out with regards to the predictive power of the US yield curve...
Investment conclusions
Based on the above, there are three investment themes we are currently recommending to our clients.
Theme #1
Use volatility to your advantage
As time passes, we think the impact of higher interest rates will be felt, and growth could weaken, as some leading indicators suggest. Buffers like the pandemic savings and a strong labor market remain, but volatility could make a comeback. Yet a strong first half of the year has historically been associated with further gains for the remainder of the year. Market pullbacks should thus be used as opportunities to add to risk assets.
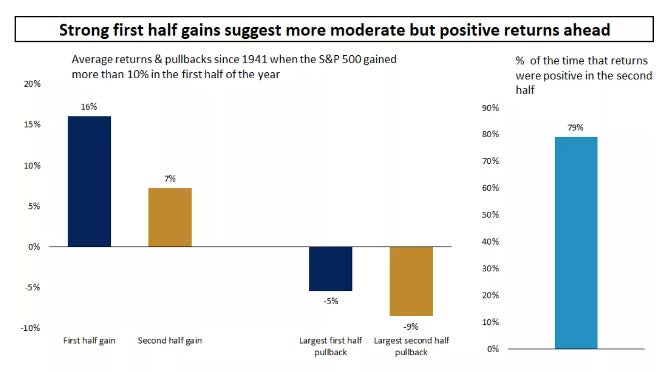 Source: Edward Jones
Theme #2
Broadening of market participation
This year market leadership has been very narrow, with just a handful of mega-cap technology stocks accounting for the bulk of this year's gains. Beyond the “Magnificent Seven”, gains have been rather modest. The return spread between the seven largest S&P 500 stocks compared to the rest
of the index is now higher than when the Dot Com Bubble Burst.
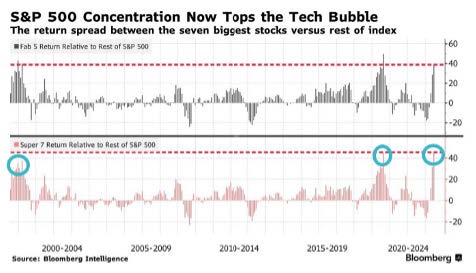
Source: Bloomberg
We therefore see an opportunity to rebalance as appropriate and diversify into the lagging segments of the equity market that carry lower valuations. These include value-style investments, small-cap companies, traditional cyclical and defensive sectors, and international stocks.
Theme #3
Extending duration within fixed-income portfolios
With inflation continuing its downward path one year after peaking, and with the Fed potentially preparing to end its rate hikes, last year's peak in bond yields is likely to hold. With long-term bonds re-establishing their negative correlation versus equities this year, we see an opportunity to add longer-duration bonds to fixed income portfolios. These bonds not only offer the opportunity to lock decent coupons for a longer period, but may also appreciate if yields start to move lower as economic growth softens and the Fed starts pausing or cutting rates down the road.
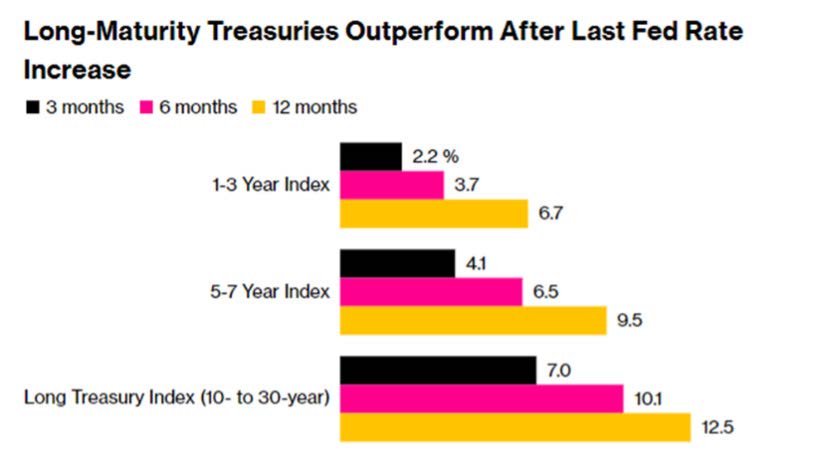 Source: Bloomberg
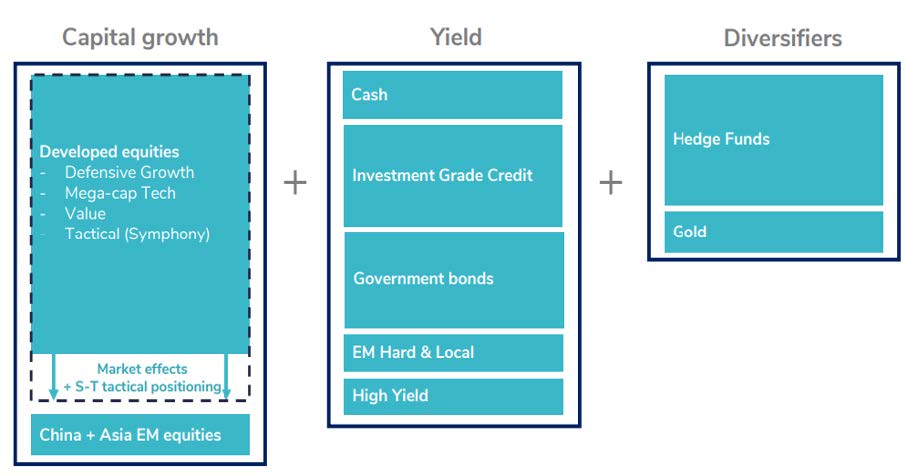
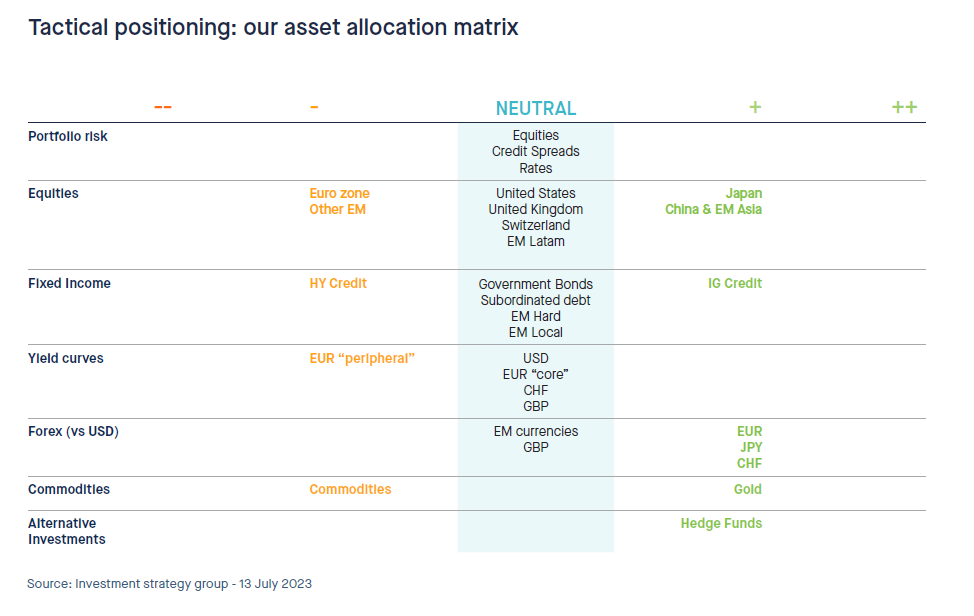
From an asset allocation perspective, the equity market's strong gains in the first half of the year, combined with a still uncertain economic outlook leads us to continue favouring an “all-weather” portfolio allocation. Within equities, we favour developed markets with a focus on quality and a high level of diversification in terms of regions and style. Market effects and the use of a highly flexible equity allocation tool based on market factors (Symphony) have pushed the equity allocation to neutral versus a strategic asset allocation. Within fixed income, we have a balanced allocation between government bonds and credit. We favour high quality issuers and have been progressively increasing our duration towards the benchmark. We continue to include diversifiers such as hedge funds and Gold. When it comes to currency exposure, we continue to stay long on most G10 currencies against the dollar.
An illustrative view of a balanced portfolio (the size of the boxes roughly indicates the relative allocation of the various “buckets”)