Charles-Henry Monchau

Chief Investment Officer

Adrien Pichoud

Chief Economist & Senior Portfolio Manager

Gaël Fichan

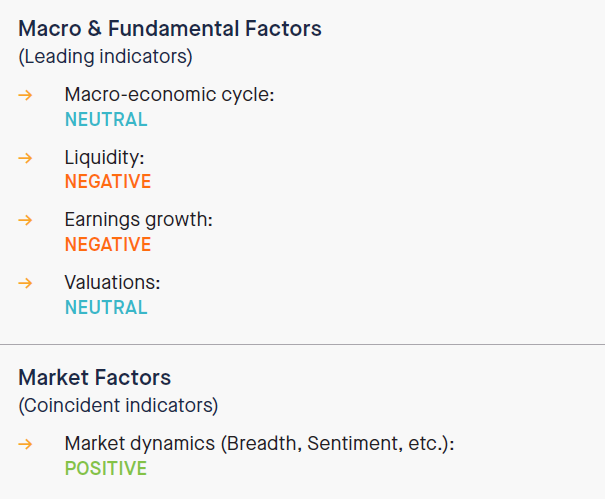
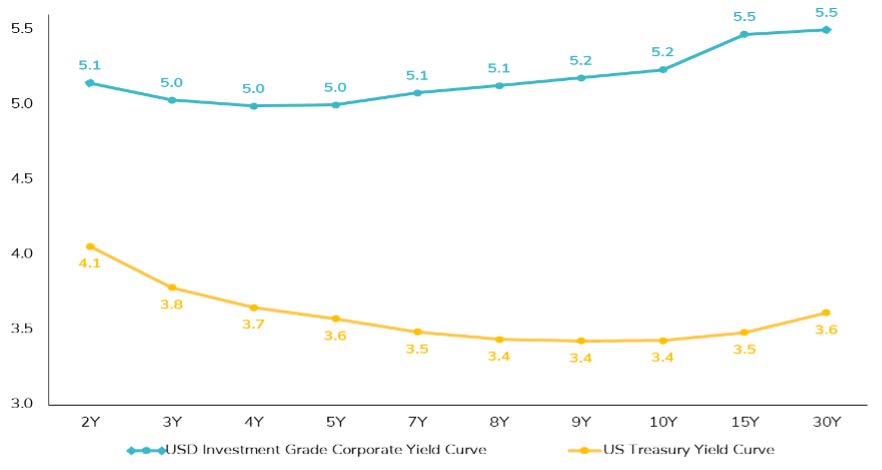
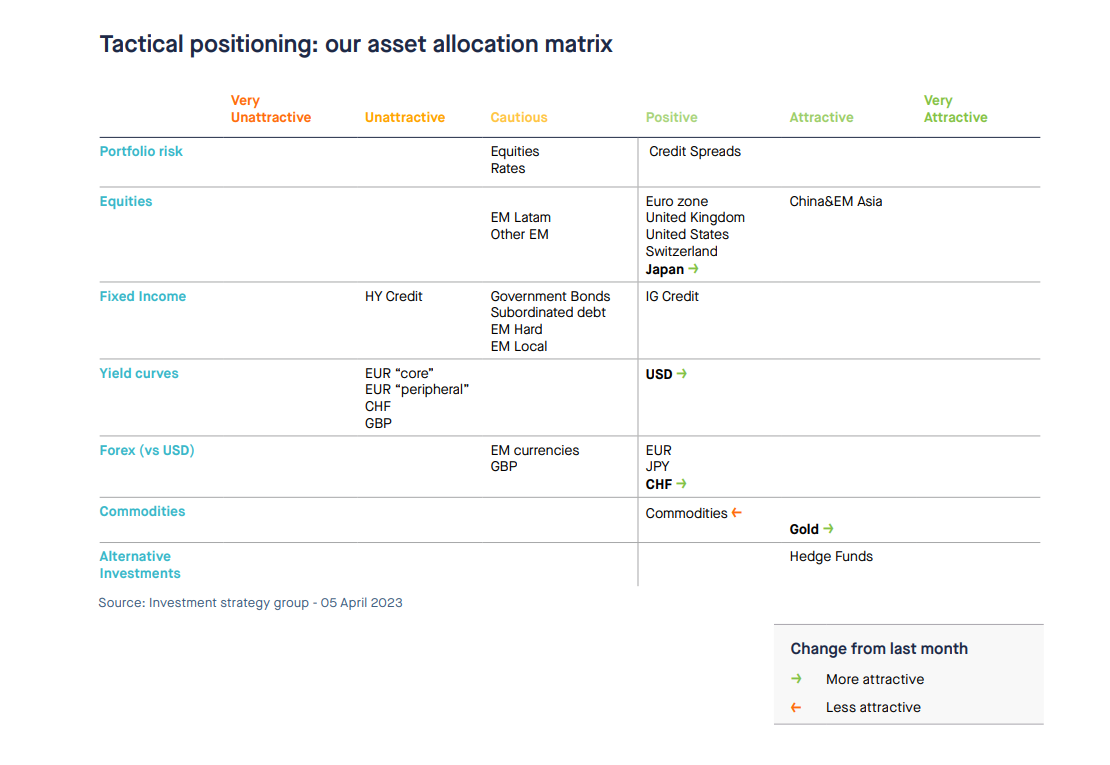
We are also keeping our positive view on credit, while upgrading the USD yield curve preference from cautious to positive. Other changes include a downgrade of our view on commodities from attractive to positive, and upgrading Gold from positive to attractive. The CHF is also upgraded against dollar from cautious to positive. Last but not least, we are upgrading Japan equities from cautious to positive. 

The big picture

Six months have passed since the S&P 500 index touched a 25% peak to through drawdown last year. The main US equity benchmark is up more than 17% from its 12th of October 2022 closing low. Can we thus declare the bear market over? 
There are indeed some reasons to be cheerful. First, the technical situation is improving for equities including for the most watched benchmark: the S&P 500. Since mid-March, the downtrend in the S&P 500 has been broken. We also note that the index is now trading above the 200-day moving average, which is actually changing direction (from bearish to bullish). Finally, the index’s lows continue to be higher. 
Second, the sentiment on equities is too bearish (which is good from a contrarian perspective). Large speculators, traditionally hedge funds, saw last week their net short positions in S&P 500 e-mini futures increase to the most bearish reading since November 2011. The latest BofA Fund manager survey also shows that underweight equities and overweight cash is now a “crowded trade”. This bearish positioning means there is a lot of dry powder to be invested in equity markets if the bearish / cautious managers get wrong-footed. 

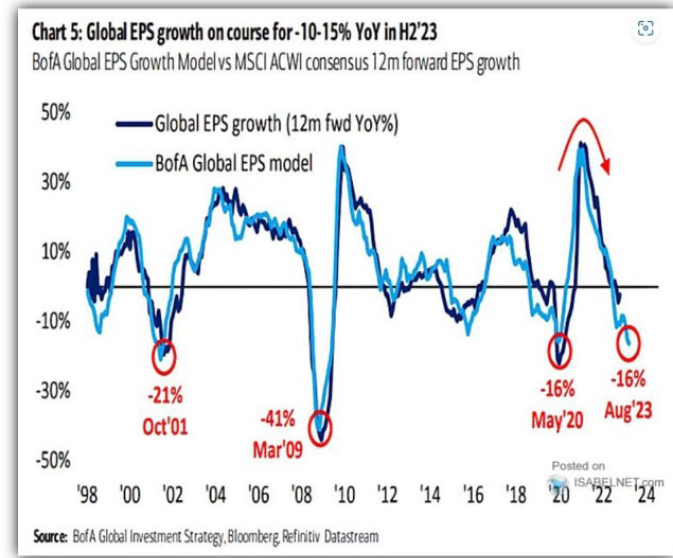
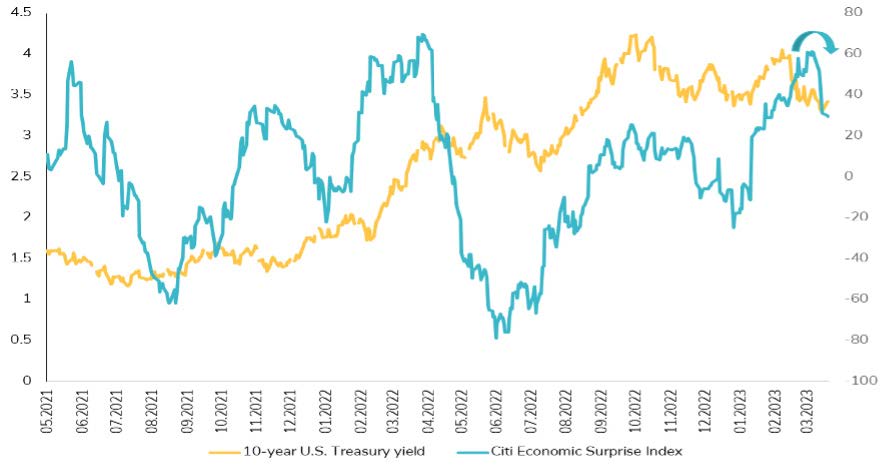
On the macro and fundamental side, there are also reasons for some optimism. Global economic growth has been resilient in the first quarter. A warmer Winter than expected led to a sharp drop in European natural gas prices, decreasing the odds of a hard landing for the economy. Various consumer sentiment indicators surprised on the upside in the US and Europe. China’s post-covid reopening continued, boosting hopes that global growth would be accelerated more broadly. Meanwhile, global inflation continues to ease. Last but not least, earnings continue to surprise on the upside: high nominal growth (real growth + inflation) remains a tailwind for companies’ top-line. Meanwhile, profit margins have been resilient, which means that on a net aggregated basis, companies are able to pass higher costs onto the consumers. This has been nicknamed as “greedflation”, a situation where companies increase their prices more than necessary in order to make as much money as they can (while they can still afford to do it). 
But despite the bull case, there are also reasons to be fearful. To start on the technical side, let’s keep in mind that recent market leadership is less supportive than it was a few months ago. Discretionary vs. Staples, Transports vs. Utilities, Small vs. Large, Copper vs. Gold, and High Beta vs. Low Beta are meaningfully softer today compared to earlier this year. Notably, the equity market’s leadership profile looks more consistent with an economic slowdown, as does the continued message from the bond market (i.e. the entire yield curve is inverted).

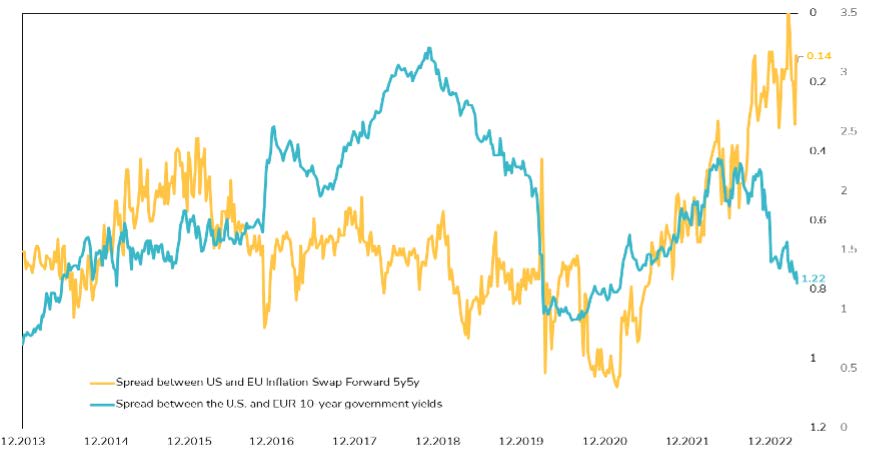
The current growth/inflation mix cannot be seen as supportive for risk assets. While inflation is declining on the back of favourable comps and lower energy prices, 
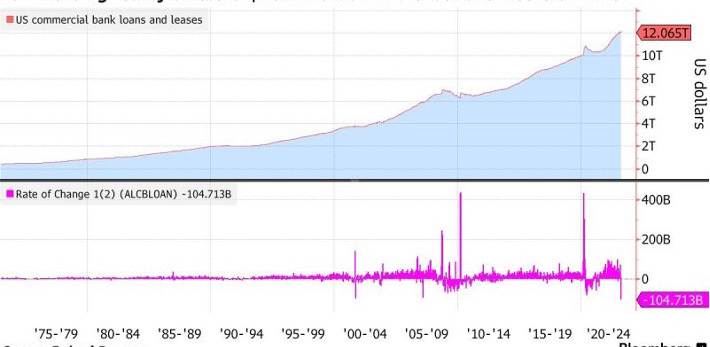
we expect global growth to decelerate as well. The recent banking crisis in the US (but also in Europe due to Credit Suisse woes) should significantly tighten lending standards. This will have consequences on economic activity at a time when consumers are facing higher mortgage, higher credit card interest payments and declining real wages growth. 


US bank lending dropped dramatically in March

pic 1-Apr-13-2023-09-30-52-1550-AM

Source: Bloomberg

Liquidity conditions are still not supportive. While the Fed balance sheet has soared on the back of the SVB debacle, this should not be considered as the end of 
QT (“Quantitative Tightening”) and the start of a new QE (“Quantitative Easing”). The Fed has been providing ample liquidity to the banking system, which is very different than purchasing sovereign and corporate bonds in the open market. We note that US Money supply is collapsing. US M2 growth plunged to -2.4% YoY in February, the lowest in history. This can be interpreted as a recession warning.

US M2 YoY%

pic 2-Apr-13-2023-09-32-36-9968-AM

Source: Bloomberg

As mentioned in our previous asset allocation insights document (see March 2023 “Fed tightening “dynamite fishing” starts to hurt”), monetary policy tightening is 
like dynamite fishing: when the blast hits, it decimates everything in the vicinity. The small fishes rise to the surface first. But it can take some time for the whale(s) to show up. With the unwinding of Silicon Valley Bank and Signature Bank in March, it is clear that the aftershock of the Fed's policy tightening is starting to be felt. But should we see these two banks as whales or as just being those small fishes? At this stage, it is very difficult to answer this question. However, we believe that we have entered a new period of uncertainty where the weakest links of the economy will be under rising pressure (commercial real estate, subprime auto loans, credit cards loans, etc.) 
With regards to earnings growth, the aforementioned “greedflation” is most likely unsustainable over the medium to long-run. Indeed, consumers might not be able to 
afford higher prices for longer. We expect global earnings expectations to start declining in the second half of the year. Typically, forward earnings estimates start to recover between three and six months after a durable market bottom. Equity valuations can barely be seen as attractive, especially in the US. The equity risk premium (S&P 500 earnings yield minus 10-year US yield) remains too low and does not compensate for the current tail risks (banking crisis, inflation, geopolitics) the market is facing. 
Last but not least, we need to keep in mind that stocks rarely bottom as US-Fed hikes. Market hopes are that equities will rally once the Fed announces the end of the rate hike cycle. But recent history suggests that bond yields and the S&P 500 decline in the months that follow the end rate hike cycles. 

How did the S&P 500 and US 10-year Treasuries behave following the end of the Fed rate hike cycle?

Picture2-Apr-11-2023-02-47-43-2449-PM

Source: Bloomberg


Indicators review summary

Our tactical asset allocation process is based on five indicators.

Indicators review summary


Indicator #1

Macro-economic cycle: Neutral (from Positive)

Current macro-economic dynamics remain positive, supported by tight job markets on both sides of the Atlantic, fueling strong domestic demand and solid services sector activity. The ongoing recovery in Europe after the energy-led slowdown of late 2022 also contributes to a positive global momentum, as well as the reopening of China.
However, cyclical sectors (manufacturing, real estate, banks…) are under rising pressures from tighter financial conditions. March’s developments (SVB/Signature, CS, deposit decline in the US, US CRE worries…) suggest that the tipping point where rising rates seriously bite into economic activity could soon be reached.
On top of that, additional headwinds such as the US debt ceiling deadline or a potential rise in energy prices triggered by supply reduction, may also impact economic growth later this year.
The combination of still ongoing positive growth momentum, on the one hand, and rising headwinds and risks on the other hand, makes for an overall Neutral score for the macro-economic cycle. The risks are clearly tilted toward the downside, but the current benign growth environment might extend for some time, until the loss of cyclical momentum eventually drag economies in recession by undermining job market dynamics.

Indicator #2

Liquidity: Negative

The rate hike cycle is not over yet (cf. March rate hikes by the Fed, the ECB, the SNB or the BoE) .
Central banks still face inflation rates significantly above their targets. 
Even more worrying for central banks is the fact that inflation is currently driven by rising service prices and higher wages (and no longer by “exogeneous factors” such as energy & commodity prices or supply chain bottlenecks) Providing liquidity to a wavering banking sector (against sound collateral), as central banks did in March, is very different from injecting liquidity into financial markets as they did with Quantitative Easing programs. As a matter of fact, the gradual unwinding of QE bond purchases has not been halted, neither by the Fed nor by the ECB.
Higher rates and declining bond holdings by central banks continue to tighten financial conditions and reduce available liquidity in the economy and markets. Short-term liquidity facilities to prevent the banking system from seizing up are different by nature, and are unlikely to balance or reverse the impact of higher rates and Quantitative Tightening.
Liquidity conditions therefore remain Negative for the time being, and are likely to be so until tangible signs of imminent recession risk and/or significantly softer inflation appear

Indicator #3

Earnings growth: Negative

While global earnings have been resilient so far, a margin squeeze (lower demand weighing in revenues, higher labor and input weighing on margins) could be around the corner and would imply negative operating leverage. 
According to BofA estimates, global EPS could decline by as much as -10%/-15% in the second half of this year. 

pic 4-2

Indicator #4

Valuations: Neutral

US equities derated in 2022 but is still expensive in historical term and remains less attractive than bonds. This is also why we believe that a risk premium re-rating might take place: there is not enough cushion on the valuation side for US equities.
European and Japan equities valuations are more attractive than their US counterparts. 

Indicator #5

Market dynamics: Positive (from Neutral)

In the US, the trend, technical, breadth and volume are all positives while sentiment remains neutral. Market breadth indicators were particularly volatile in March, turning red before mid-month, and then gradually improving to close the month in positive territory.
In Europe, the trend varies between positive and neutral 
(Rate of change is neutral). Technicals are neutral while breadth, sentiment and volume are positive. Market breadth was more stable than in the US, but technical indicators turned red mid-month before being back in the neutral zone. 
Overall, the downside risk to the macro pillar (not yet compensated by an improvement on the monetary policy, earnings growth or valuations pillars) leads us to adopt a cautious stance on both equities and credit. The positive rating in market dynamics keeps us on alert for a potential upgrade of our equities stance in case of any major fundamental improvement.


Asset Allocation decisions

We believe that we have entered a new period of uncertainty, which should lead to an Equity Risk Premium re-rating. As such, we keep our cautious stance on equities. 
Our Goldilocks scenario is at risk: while global inflation is softening, recession risk is increasing, and earnings/margins are likely to be under pressure. As aforementioned, liquidity conditions are still not supportive for risk assets. While the Fed is close to the end of rate hiking cycle, a “pivot” would be subject to macro deterioration (which will be itself a negative for risk assets). 


From a regional standpoint, we keep an attractive view on China & EM Asia. We remain positive on the US, Europe ex-UK, UK and Switzerland. We are upgrading Japan from cautious to positive. This view is made from a total return  (local currency return + forex) point of view. We believe that Japanese equities can perform reasonably well despite the strength of the yen. Some domestic sectors are benefiting from higher nominal growth (due to higher inflation) while the export sector is exposed to the reopening of the Chinese economy. We keep a cautious stance on EM Latam and other EMs. In terms of sectors, size and style, we continue to favor defensive over cyclicals, large caps over small caps and keep a balance between growth and value. 


Within Fixed Income, we keep our cautious stance on  rate while upgrading the USD yield curve preference from cautious to positive on the back of signs of macro deterioration in U.S. We still favor the front end as it offers a decent carry and low-rate sensitivity, while the historical level of yield curve inversion argues for staying away from the long end. Positive economic surprises (1-year high) in US seem to have peaked, which could ease the pressure on LT yields, but the recent rally doesn’t offer attractive entry point for now.


Positive economic surprises have peaked in the United States

pic 6-Apr-13-2023-02-44-47-8336-PM

Source: Bloomberg


Liquidity has temporarily improved as the Fed has eased its access to liquidity (overnight repo that goes into bank reserves), but the Fed didn't buy bonds through SOMA. As such, there is no direct reversal of the recent QT trend. Our preference on USD rates over EUR rates is justified by the fact that ECB still needs to catch-up: ECB President Lagarde recently reiterated concerns that core inflation is "far too high", and that the ECB still has "ground to cover" to bring inflation back to 2% while ECB’s Holzmann stated that a half point hike is still on the cards for May. We still continue to avoid peripheral rates as the yield pick-up is not sufficient to compensate weaker fundamentals and higher volatility.

Gap between US and European inflation expectations vs the spread between USD and EUR yields: European rates have yet to close the gap

pic 7-Apr-13-2023-02-46-43-0215-PM

Source: Bloomberg

We have kept our positive stance on Credit while we rate high yield investments as unattractive. We favor 0-to-10-year segments due to the steepness of the credit spread curve which fully offset the inverted U.S. Treasury yield curve. Absolute yields are still offering attractive long term entry point. We focus on high quality corporate bonds that have proven their robustness even if money market funds compete the entire credit spectrum. European high yield is more attractive than U.S. high yield due to valuations that reflect heightened fears of a deeper recession in Europe and consequently higher default rates. The European premium has piled up again since the Credit Suisse affair. The current valuation of U.S. high yield spreads implies modest default rates and the absence of inflation slippage, or a near-term recession and this time higher oil prices should not help the segment. But in absolute term, High yield bonds are not expensive.


The steepness of the credit curve fully offsets the inversion of the Treasury yield curve
pic 8-1

Source: Bloomberg

Subordinated is a matured and resilient asset class offering large premiums, with cheap valuation (absolute/relative) due to Credit Suisse developments. The European authorities have firmly stated once again that AT1s are important and that they are senior to shareholders in the capital structure. Capital positions are solid, but we recognize that investors have become wary again. Fundamentals benefit from rising interest rates. If there is no recession in Europe in 2023, banks will benefit fully.


Subordinated is offering cheap valuation (absolute/relative) due to CS developments.


pic 9-1
Source: Bloomberg
We remain positive EUR and JPY versus USD. We are upgrading our stance on the CHF against USD from cautious to positive. With the Fed likely to pause sooner than other developed markets’ central banks and with the debt ceiling issue likely to hit headlines in the coming weeks, we expect the greenback to stay under pressure.
We are upgrading Gold from positive to attractive. Gold prices have risen strongly following the collapse of several US regional banks, the fallout of Credit Suisse and rising risks of banking instability in Europe as investors have been seeking refuge in the ultimate safe-haven asset: Gold. The statement “gold is nobody's liability and carries no credit risk” sounds more fitting that ever. Other tailwinds for the yellow metal include the following: 1) We are approaching the end of the rate hiking cycle and real yields keep declining; 2) Continued solid physical demand thanks to continued central banks’ buying particularly from China and Russia which, lately, have keen to diversify their reserves away from the dollar will continue to support gold in 2023; 3) Gold ETF buying which reflects retail investors' flight to safety following the banking crisis and 4) Falling investments in exploration as the industry currently prefers to focus its exploration activity on base / battery metals.
Meanwhile, we are downgrading Commodities from attractive to positive as we believe the macro headwinds will weigh on the demand outlook for energy and industrial metals.  
We keep an attractive view on Hedge Funds. Macro hedge funds and equity long-shorts should benefit from current market conditions. 
Overall, we currently aim at running an “all-weather portfolio”. Our exposure to capital growth includes allocation to developed equities through a well-diversified portfolio which includes both growth and value large-cap stocks. We also have an exposure to China and EM Asia stocks. Yield is generated through cash, investment grade credit, government bonds, EM bonds as well as a small allocation to High Yield. Diversifiers include hedge funds, gold, commodities and long duration US government bonds. 
 

An illustrative view of a balanced portfolio (the size of the boxes roughly indicates the relative allocation of the various “buckets”)

pic 10


Tactical positioning: our asset allocation matrix

new graph AAI-1


Disclaimer

This marketing document has been issued by Bank Syz Ltd. It is not intended for distribution to, publication, provision or use by individuals or legal entities that are citizens of or reside in a state, country or jurisdiction in which applicable laws and regulations prohibit its distribution, publication, provision or use. It is not directed to any person or entity to whom it would be illegal to send such marketing material. This document is intended for informational purposes only and should not be construed as an offer, solicitation or recommendation for the subscription, purchase, sale or safekeeping of any security or financial instrument or for the engagement in any other transaction, as the provision of any investment advice or service, or as a contractual document. Nothing in this document constitutes an investment, legal, tax or accounting advice or a representation that any investment or strategy is suitable or appropriate for an investor's particular and individual circumstances, nor does it constitute a personalized investment advice for any investor. This document reflects the information, opinions and comments of Bank Syz Ltd. as of the date of its publication, which are subject to change without notice. The opinions and comments of the authors in this document reflect their current views and may not coincide with those of other Syz Group entities or third parties, which may have reached different conclusions. The market valuations, terms and calculations contained herein are estimates only. The information provided comes from sources deemed reliable, but Bank Syz Ltd. does not guarantee its completeness, accuracy, reliability and actuality. Past performance gives no indication of nor guarantees current or future results. Bank Syz Ltd. accepts no liability for any loss arising from the use of this document.

Read More

Straight from the Desk

Syz the moment

Live feeds, charts, breaking stories, all day long.

Thinking out loud

Sign up for our weekly email highlighting the most popular posts.

Follow us

Thinking out loud

Investing with intelligence

Our latest research, commentary and market outlooks