Charles-Henry Monchau

Chief Investment Officer

Luc Filip

Head of Discretionary Portfolio Management

Adrien Pichoud

Chief Economist & Senior Portfolio Manager

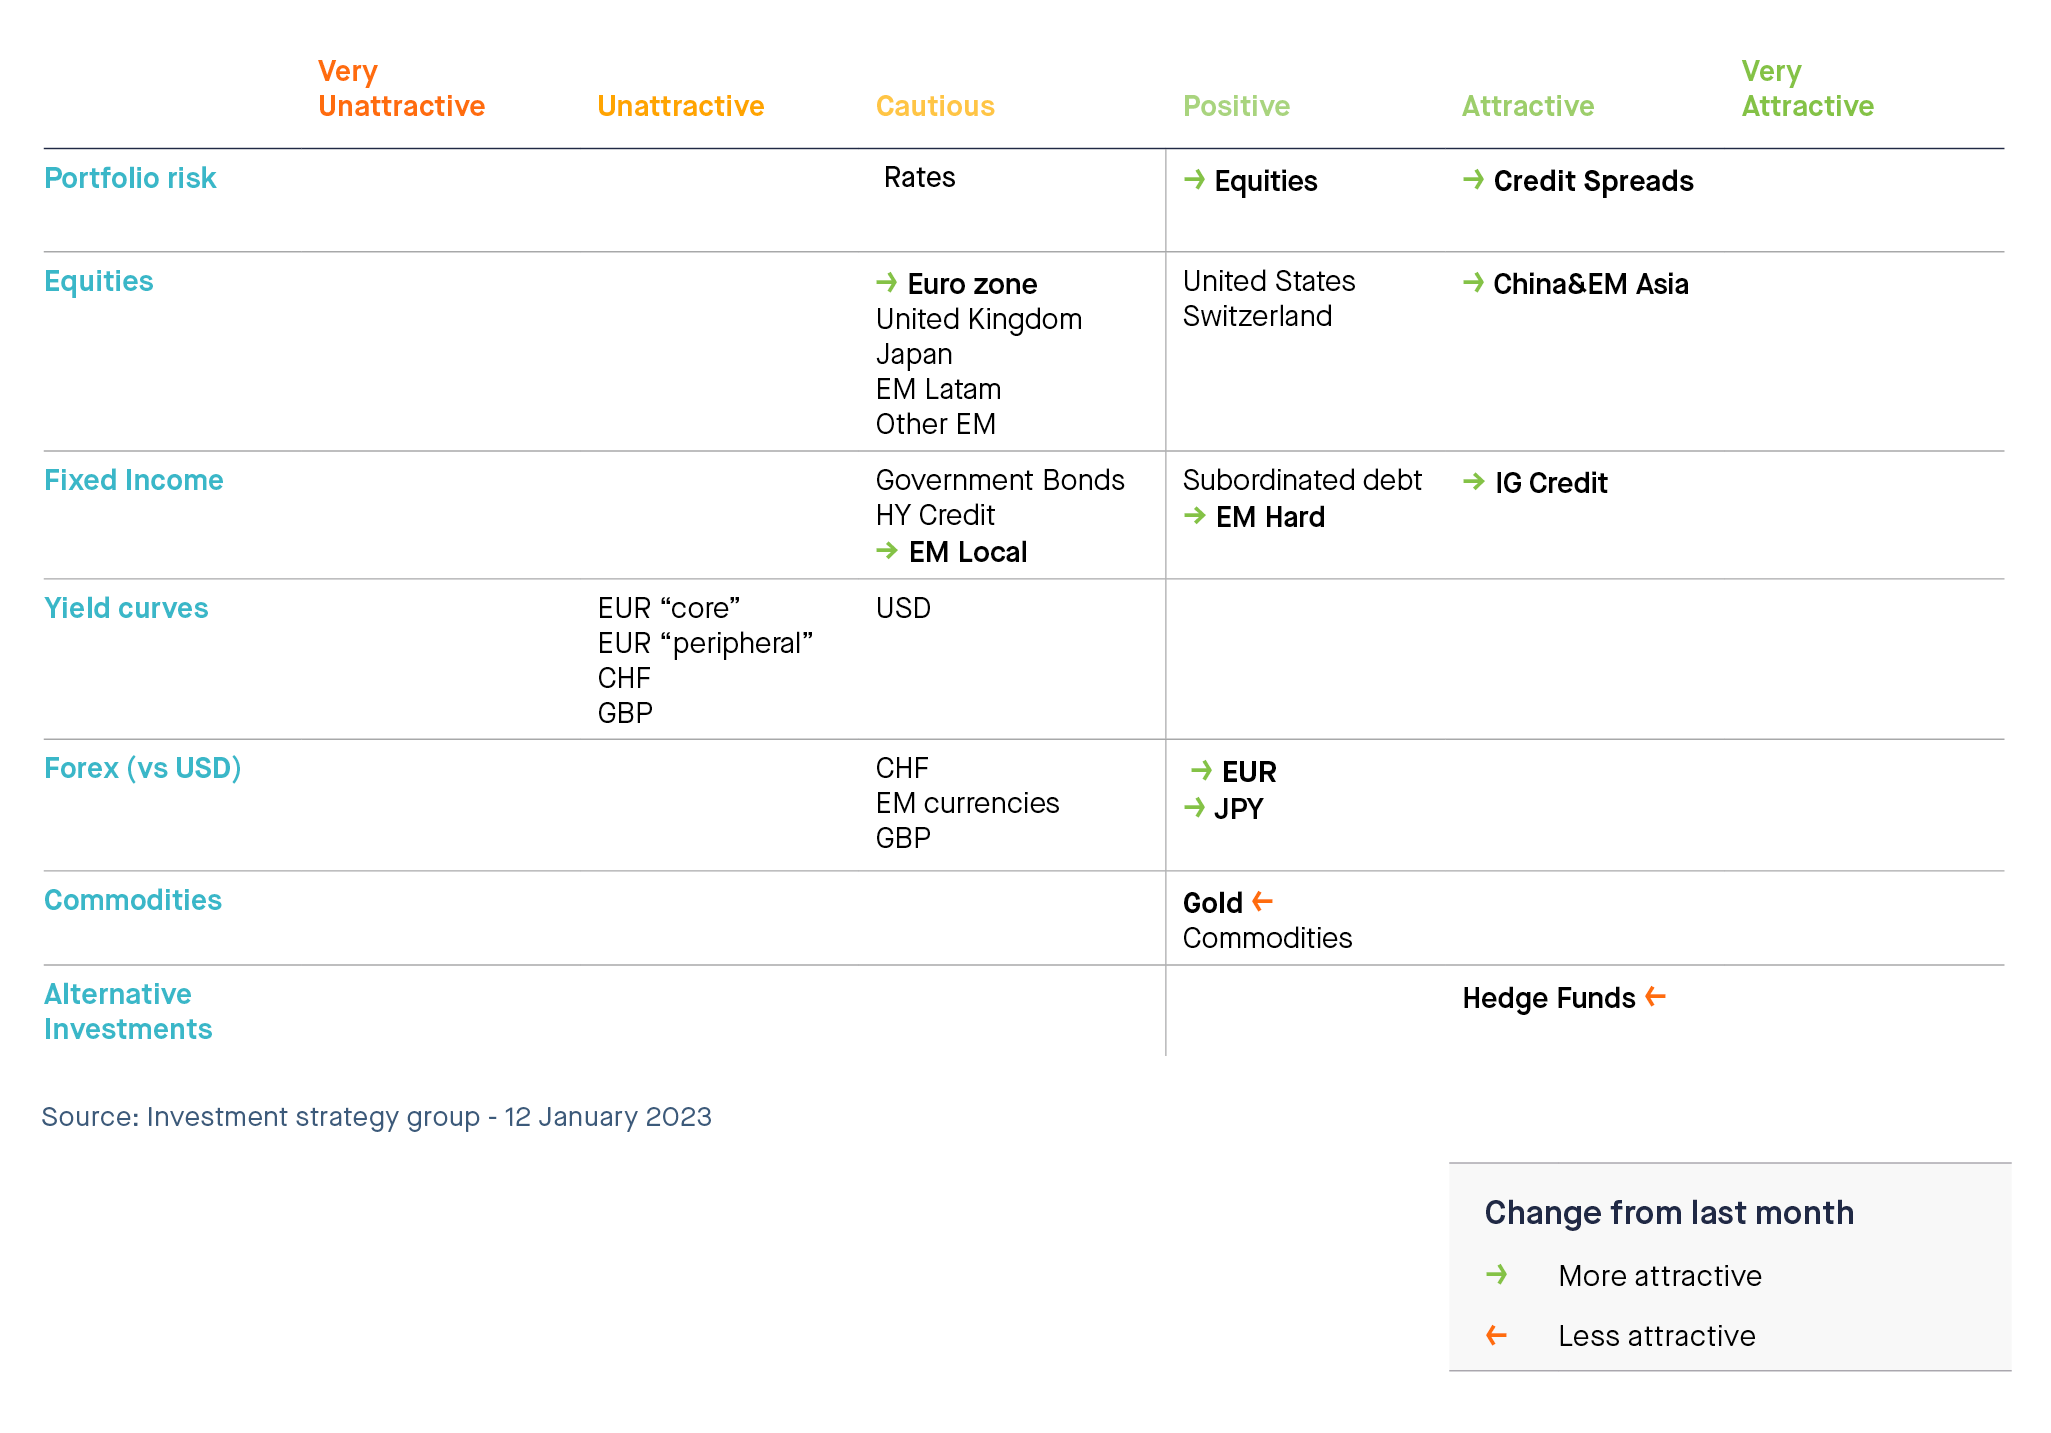
Key changes to our asset allocation (one-month view)

2023 started with a mirror image of the trends that prevailed last year: the US dollar is weakening, bond yields are falling and stocks are rising. Are we witnessing a classical positive seasonal effect or is the improving sentiment a reflection of a macroeconomic and fundamental outlook improvement? 

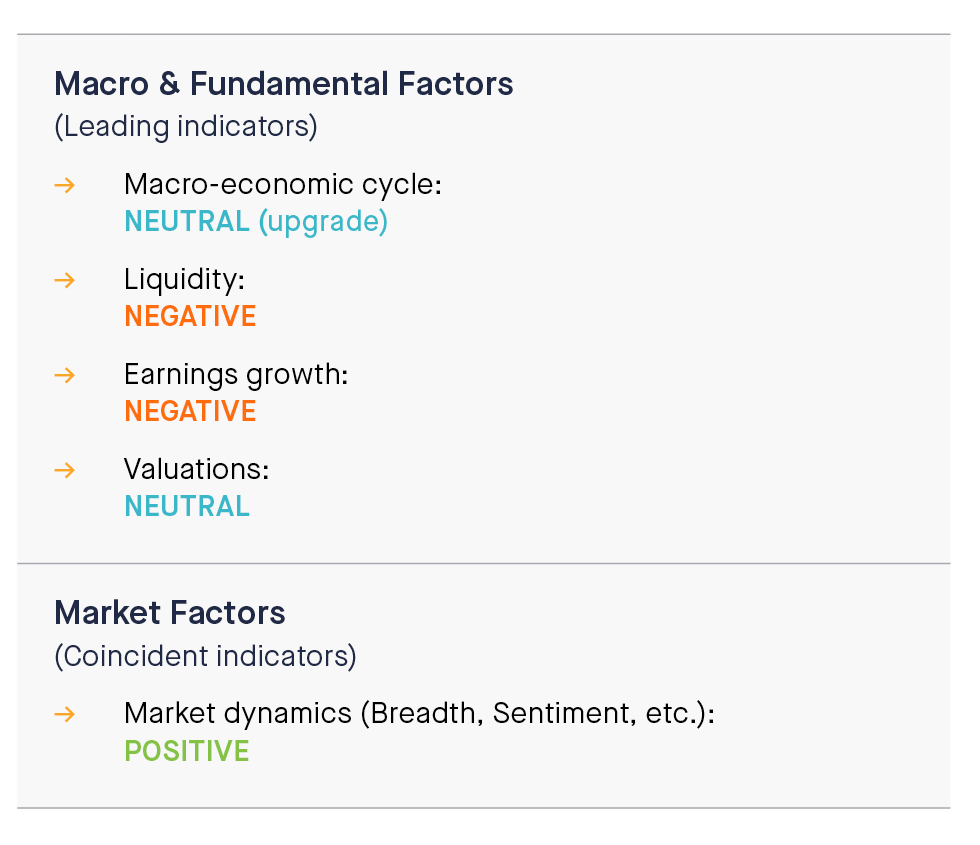
Our one-month tactical view is based on the weight of the evidence derived from the aggregation of our fundamental and market indicators. Compared to the previous months, we believe there is indeed a marginal improvement in some of our leading indicators (e.g macroeconomic outlook – see next section) while our coincident indicators (i.e market dynamics) continue to point towards positive developments in terms of trends, technicals and market breadth. 

As a consequence, we are upgrading our stance on global equities from “cautious” to “positive”. 

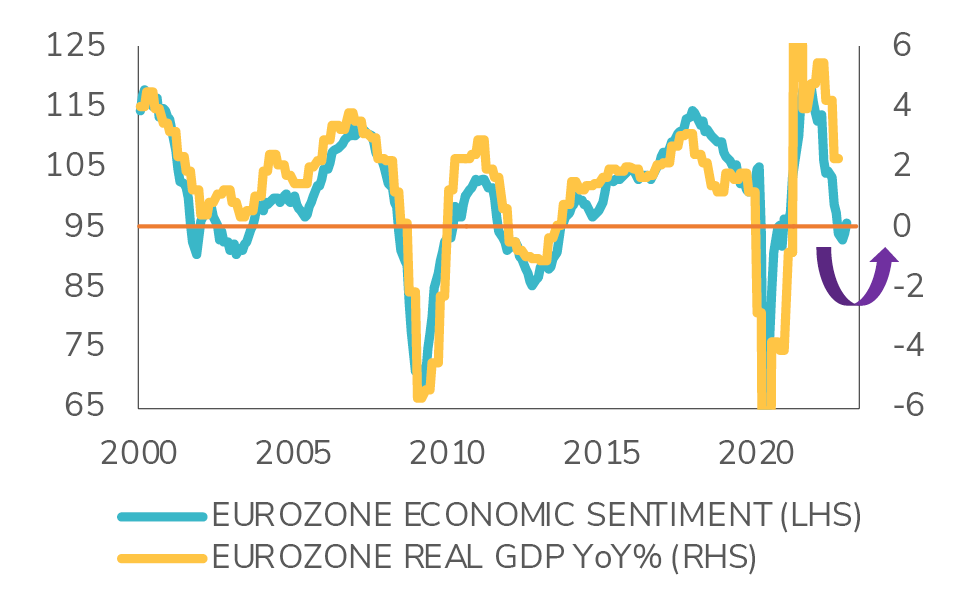
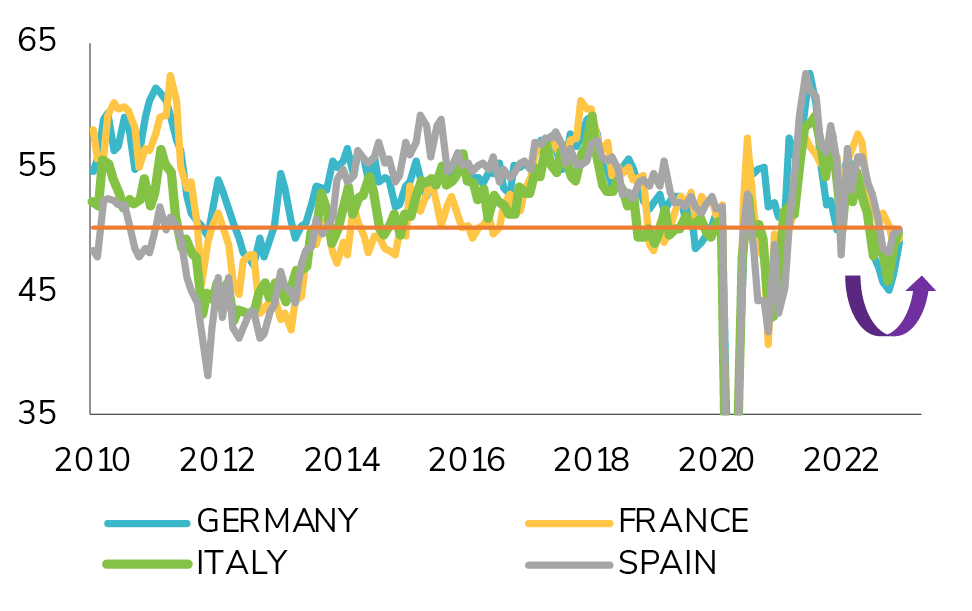
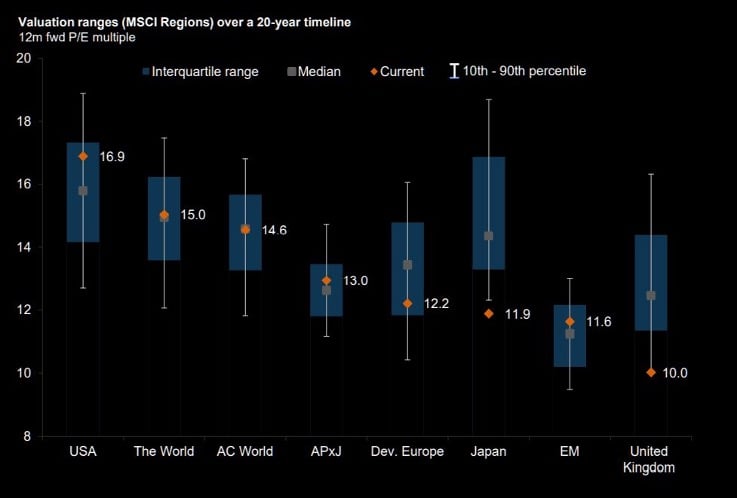
From a regional standpoint, we are shifting our view on Eurozone equities from unattractive to cautious (see asset allocation preferences  page 5). The European economy is benefiting from milder weather than expected and from the reopening of China. We note that valuations remain cheap despite the recent rally. We are upgrading EM Asia / China from positive to attractive. Our favourable thesis on this region is reinforced by the reopening of China after 3 years of strict lockdown. Chinese consumers have substantial savings; this should benefit not only the local economy but also the demand for domestic stocks. 

We remain positive on Switzerland and the US. We are cautious on UK, Japan, EM Latam and other EM.

In Fixed Income, we maintained a “cautious” stance on rates while upgrading credit from positive to attractive. Despite the recent tightening of spreads, the risk/reward remains attractive due to the high level of carry and lower volatility rate expectations. While we were already positive on credit, especially on the front end of the yield curve, we are moving to longer investments in the 5-10 year

segments.  As a result, we are changing our view on investment grade credit from positive to attractive. Emerging Market hard currency debt offers attractive absolute yields and should benefit from declining inflation, robust fundamentals and a weaker U.S. dollar. We therefore upgraded this segment from cautious to positive. We are also upgrading our view on Emerging Market local currency debt from unattractive to attractive, as the rate hike cycle appears to be coming to an end in many emerging markets.

This slight increase in the risk of our model portfolios is financed by a downgrade of our positions in Gold (from attractive to positive) and hedge funds (from very attractive to attractive). The yellow metal seems to benefit from growing demand by central banks and the pullback from the dollar. We note a dichotomy between the rise in Gold prices and real interest rates (which are still not moving down). While we continue to like Gold as a portfolio diversifier, it is currently overbought – hence the downgrade. With regards to hedge funds, macro and CTA strategies remain among the best portfolio diversifiers. The downgrade in our preferences is thus only justified by the allocation increase to riskier segments. 

We remain positive on commodities. China’s re-opening should increase demand for key commodities such as oil and metals. 

Last but not least, we are moving our stance on the euro and the yen against the dollar from cautious to positive. The resilience of the eurozone economy will most likely incentivize the ECB to keep increasing rates while quantitative tightening will effectively start in March. At the same time, the Fed is getting closer to the end of its monetary policy tightening cycle. Interest rate differential is thus becoming more favourable to the euro. The macroeconomic and liquidity context is also shifting in Japan. While the Bank of Japan was reluctant to loosen its grip on yield curve control last year, rising inflation and selling pressure on JGBs is forcing President Kuroda to adopt a more hawkish tone. This should benefit the yen.


Indicators review summary

Our tactical asset allocation process is based on five indicators. 

We are upgrading our Macro-economic cycle from “negative” to “neutral” as we believe that the growth / inflation context is becoming more favourable to risk assets (see details below). Other macroeconomic and fundamental indicators remain unchanged. 

The most dynamic factor of our process – market dynamics – remains firmly in “positive” territory. 

On an aggregated basis, our indicators are pointing towards a “POSITIVE” view on risk assets.

pict1


Indicator #1 

Macro-economic cycle: from Negative to Neutral 

Global economic growth continues to slow down. However, we note that economic surprises are no longer negative in key economic areas, as the consensus already expects a significant economic slowdown. Moreover, a deep global recession looks unlikely: driven by a combination of China’s re-opening, falling natural gas prices (which is boosting European growth expectations) and a resilient consumer in the US and Europe, the market is being forced to upgrade its pessimistic growth outlook for this year. Peak recession fears may end sooner rather than later and the second half of the year could very well see a renewed pick-up in economic activity, precisely at the time when major central banks stop hiking. 

On the inflation side, latest data remain way above central banks’ target. Nevertheless, they are starting to cool down. U.S. Headline CPI for December came in right as expected with a 0.1% decline MoM, leaving the YoY number at +6.5% as expected. Energy was the biggest driver of the decline in the YoY print along with goods costs, which tumbled to its lowest since Feb 2021. However, services inflation soared to its highest since Sept 1982. Main reason: Shelter, which is still rising on a MoM basis. Shelter was the biggest contributor to Core CPI 0.3% MoM gain. New leases and home prices tend to lead the shelter CPI by several quarters, and both have been declining in response to the spike in borrowing costs. It might be later in the year, but housing inflation should start moderating, as suggested by the more timely data. 

Looking ahead, we might encounter a situation where inflation starts to cool down meaningfully, while the global economy stays relatively resilient. This outcome is a clear improvement versus last year and lead us to upgrade our macro view from negative to neutral. 

Mild winter temperatures help contain the sharp growth slowdown led by energy prices

pict2

pict2.2Source: Banque Syz, FactSet 


Indicator #2 

Liquidity: Negative


Central banks remain firmly on the path of rate hiking. To regain control on inflation, and preserve its credibility, the Fed has no choice but to tighten monetary policy until there are clear and tangible signs of a reversal in inflation dynamics.

Overall, the liquidity environment remains negative for risk assets as most developed markets are facing more rate hikes, quantitative tightening and global liquidity reduction. Nevertheless, we are getting closer to a Fed pause and the pace of rate

hikes is slowing down, i.e the second derivative is starting to improve. Indeed, the fact that inflation is cooling down and that U.S. employment has probably peaked should soon give an opportunity for the Fed to pause its monetary policy tightening cycle. This might be enough to ease financial conditions and would be a positive for risk assets. 


Indicator #3 

Earnings growth: Negative


The blended MSCI USA earnings growth rate is +6.7% for 2022e and +3.6% for 2023e. We believe that expectations for 2023 are too optimistic as companies might face negative operative leverage: they will not be able to pass on more costs to the customers (lower nominal sales growth) while they will have to absorb higher wage and input costs. Historically, EPS have declined meaningfully during recessions.

In Europe, there is still some room for downward revisions as well (despite favourable forex effect). Indeed, after a 19.9% earnings growth expected in 2022e, MSCI Europe earnings are expected to grow by 0.9% in 2023e. This also looks too optimistic in light of recent PMI data and based on the probability that the European economy will slow down this year.

While earnings growth has been a tailwind for equity markets in 2022, we believe that this will no longer be the case in 2023. As such, we have a negative stance on the earnings growth indicator. 

The bright spot might come from emerging markets such as EM Asia / China. 


Indicator #4 

Valuations: Neutral


Global equity valuations have de-rated in 2022. In the U.S., the S&P500 multiple has de-rated by the same magnitude as seen in previous recessions. On a relative basis, Equity Risk Premium is a headwind now, as it has probably reached a bottom. We note that cash and bond yields are now competing with equities. Overall, this indicator remains NEUTRAL. Equity markets are less expensive than at the start of 2022, but they are not cheap either. However, there are clear differences across regions. For instance, Europe, UK and Japan 12-month forward P/E are much lower than the median P/E over the last 20 years. EM Asia is not expensive either. 

While 12-month forward P/E for MSCI USA is higher than median, valuations for Europe, the UK and Japan are very attractive. Asia is not expensive either

Picture3-2Source: Goldman Sachs


Indicator #5 

Market Dynamics: Positive 


Our market dynamic indicators are in deep positive territory – and this applies to both our U.S. and European proprietary models. The S&P 500 just broke its 200-day (still falling) moving average. It is above the 100-day and 50-day moving average. Other indicators are in positive territory as well. An interesting signal is the continuous improvement 

of market participation (breadth); indeed, while tech mega-caps have been hit during the earnings season, cyclical sectors as well as small & mid-caps have been doing reasonably well, hence the positive signal for this indicator. We also note that this rally didn’t give overbought signals (RSI), which is another positive. The volume indicator is also flashing green. 


Risks to our view

The positive market dynamics signal at a time when the global growth / inflation mix is improving while central banks could soon push the “pause” button leads us to become more constructive on risk assets (equities and credit). 

Nevertheless, we would like to stress that this is a 1-month tactical view and that there are risks attached to this scenario. 

One major risk is the fact that central banks continue to tighten their monetary policy at a time when global economic growth is slowing down. This is unchartered territory as previous economic recession cycles and bear markets were met by dovish central banks.  

Another risk could stem from the factor which is leading to a more favourable outlook on global growth, which is China’s reopening. Indeed, this could translate into higher demand for commodities which could in turn lead to higher inflationary pressure, resulting in  more hawkish central banks than currently expected. 


Tactical positioning: our asset allocation matrix

pict5

Disclaimer

This marketing document has been issued by Bank Syz Ltd. It is not intended for distribution to, publication, provision or use by individuals or legal entities that are citizens of or reside in a state, country or jurisdiction in which applicable laws and regulations prohibit its distribution, publication, provision or use. It is not directed to any person or entity to whom it would be illegal to send such marketing material. This document is intended for informational purposes only and should not be construed as an offer, solicitation or recommendation for the subscription, purchase, sale or safekeeping of any security or financial instrument or for the engagement in any other transaction, as the provision of any investment advice or service, or as a contractual document. Nothing in this document constitutes an investment, legal, tax or accounting advice or a representation that any investment or strategy is suitable or appropriate for an investor's particular and individual circumstances, nor does it constitute a personalized investment advice for any investor. This document reflects the information, opinions and comments of Bank Syz Ltd. as of the date of its publication, which are subject to change without notice. The opinions and comments of the authors in this document reflect their current views and may not coincide with those of other Syz Group entities or third parties, which may have reached different conclusions. The market valuations, terms and calculations contained herein are estimates only. The information provided comes from sources deemed reliable, but Bank Syz Ltd. does not guarantee its completeness, accuracy, reliability and actuality. Past performance gives no indication of nor guarantees current or future results. Bank Syz Ltd. accepts no liability for any loss arising from the use of this document.

Read More

Straight from the Desk

Syz the moment

Live feeds, charts, breaking stories, all day long.

Thinking out loud

Sign up for our weekly email highlighting the most popular posts.

Follow us

Thinking out loud

Investing with intelligence

Our latest research, commentary and market outlooks