Volatility made a comeback in the last few weeks, triggered by concerns that the US Federal Reserve could taper its monthly asset purchases at a faster rate and fears that the emergence of Omicron could weigh on global economic growth and contribute to supply chain disruptions.
As we are heading towards a new year, we are concerned by the high level of valuations of some market segments (e.g. US equities) at the time of normalization of monetary policies. Moreover, some technical signals such as market breadth are pointing towards some negative divergence.
That said, the weight of the evidence leads us to keep a positive stance on risk assets and equity in particular. Here’s why:
- While we had obviously not predicted the irruption of this new variant, we had stubbornly high inflation as one of our three bear risks for 2022. For the time being and even with this Omicron variant, we remain within the scope of our macro-economic outlook, i.e. we believe that the worst of concerns about stagflation have mostly been priced into markets. We expect slower, though above potential, global economic growth in 2022 and inflation to gradually normalize, although it might stay sticky for a while;
- In the near-term, we continue to believe that strong earnings growth will more than offset the coming gradual normalization in fiscal and monetary policy.
- Negative real bond yields in the vast majority of developed markets also incline us to favor risk assets over government bonds. However, we are adding some protections to the portfolios;
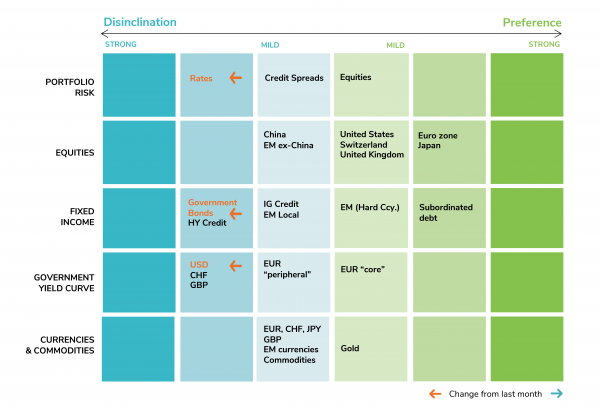
- From a tactical standpoint, we are downgrading rates, US government bonds and US Curve from cautious to disinclination due to upward risks on US long term rates. We still favor EUR Core curve over USD Curve;
- Within equities, we have a preference for Eurozone and Japan equities and are positive for US, UK and Swiss equities. We are cautious on China and Emerging Markets ex-China equities;
- We remain cautious on commodities and (short-term) bullish dollar.
- From a portfolio construction standpoint, we note that bond/ equity correlations are unstable at this stage which makes it difficult to diversify portfolios. Our tactical asset allocation is summarized in the matrix at the end of the article.
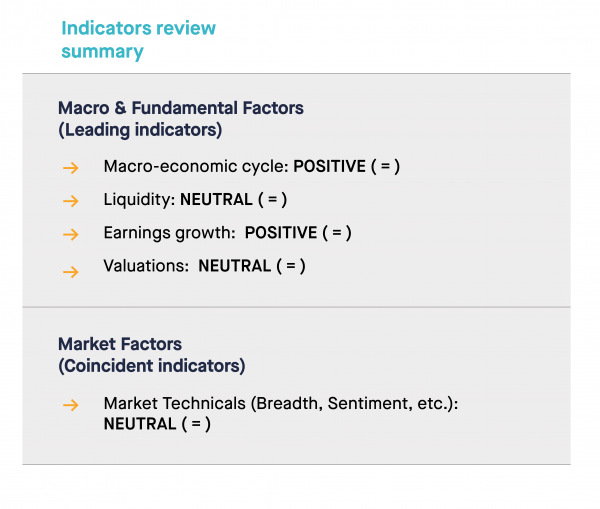
INDICATORS REVIEW SUMMARY
INDICATOR #1
MACRO ECONOMIC CYCLE: POSITIVE (unchanged)
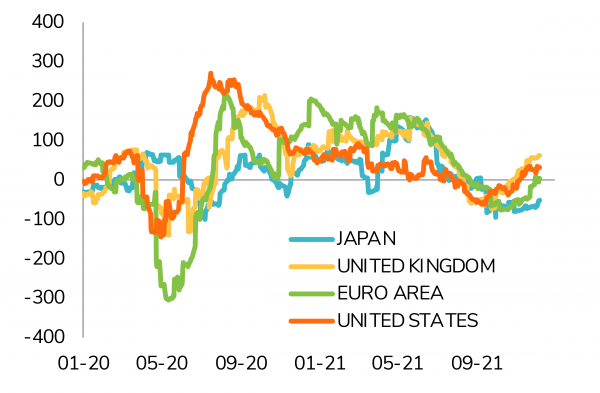
Global growth remains firmly positive, but gradually normalizes as the reopening recovery effect dissipates. We are witnessing broad-based expansion in manufacturing and service sectors, but the momentum is slowing down from high levels. Economic surprises have turned positive in Europe, like in the US. However, Latin America continues to publish negative economic surprises.
US growth momentum looks very strong at year-end. Declining unemployment rate and red-hot housing markets support strong household consumption. Price and wage inflation currently stand at a decade high, although a slowdown is still expected for 2022. However, Omicron potential disruption on supply chains could keep inflation higher for longer.
Meanwhile, China growth appears to stabilize at above 5% level. While no positive credit impulse is visible yet, the latest RRR (reserve requirement ratio) cut suggests potential for some easing going forward (not necessarily a strong one, but a level at least sufficient to support stabilization of growth rate).
INDICATOR #2
LIQUIDITY: NEUTRAL (unchanged)
Inflation continues to surprise on the upside and is now above central bank targets across all developed markets except in Asia. In the US, the Fed has given up the “transitory inflation” rhetoric. Ironically, it is precisely at the time the Fed is turning more hawkish that the market starts to price in the transitory nature of inflation as medium-term inflation expectations have been coming down over the last few weeks.
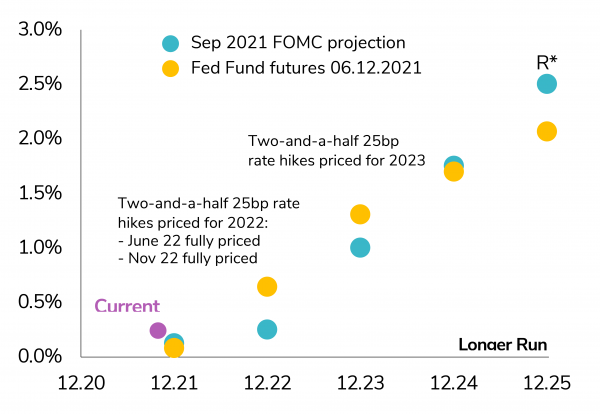
It is also interesting to note that the market is now expecting between 2 and 3 rate hikes in 2022 while pricing in rate cuts in 2023-2025. In other words, upcoming rate hikes are seen by market participants as a headwind for future economic growth. China has just started to ease (modestly) monetary policy but remains more restrictive than most other large economies where monetary policy is still ultra-accommodative.
A key development to monitor in 2022 is the fact that global liquidity may soon stop growing as the Fed aims at the end of QE by mid-22 while the ECB now consider tapering for 2022.
INDICATOR #3
EARNING GROWTH: POSITIVE (unchanged)
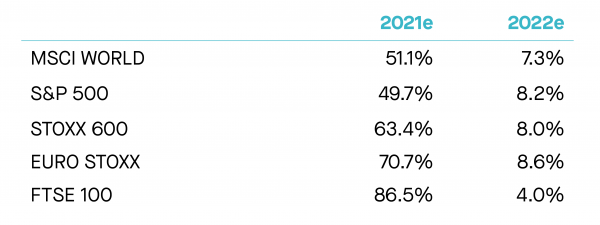
US equities have strongly outperformed the rest of the world over the last few years on the back of strong US earnings growth. Next year, we still expect robust US EPS growth. However, the growth differential between the US and the rest of the world may start narrowing. Overall, we note earnings growth expectations for 2022e seem reasonable in most regions. While top-line growth is expected to decelerate and operating margins hover around record levels, decent global economic growth, share buybacks and productivity gains leave room for some upside surprises.
INDICATOR #4
VALUATIONS: NEUTRAL (unchanged)
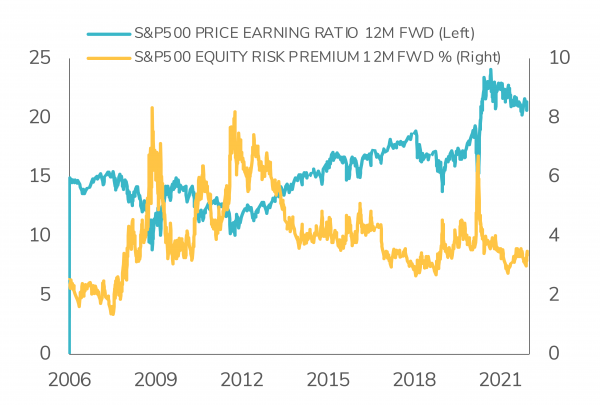
Even after the recent market correction, US equity markets still look expensive, both from an absolute and relative standpoint. On the other hand, European equity markets look fairly valued, while the equity risk premium in the UK is still attractive. We also note that valuation ratios have been improving in Japan.
INDICATOR #5
MARKET TECHNICALS: NEUTRAL (unchanged)
At the time of our writing, our proprietary technical indicators offer a mixed picture. The high frequency indicators (RSI, MACD, Mean reversion) have shown some improvement on the back of the recent correction, exhibiting positive signals (but are not oversold yet). We are also encouraged to see sentiment indicator (such as Put-Call ratio) shifting from Strong optimism (bad from a contrarian perspective) to strong pessimism (a positive). However, the medium-frequency indicators such as market breadth and Hi – Low are both flashing red, which is a clear signal of caution. The tipping point might come from our low frequency / long-term indicators, which signal that the long-term bull trend (price above 200 days moving average) still holds. Any deterioration of this category of indicator would be interpreted as an overall bearish signal.
ASSET CLASS PREFERENCES
EQUITY ALLOCATION
Positive (but adding protection to the portfolio)
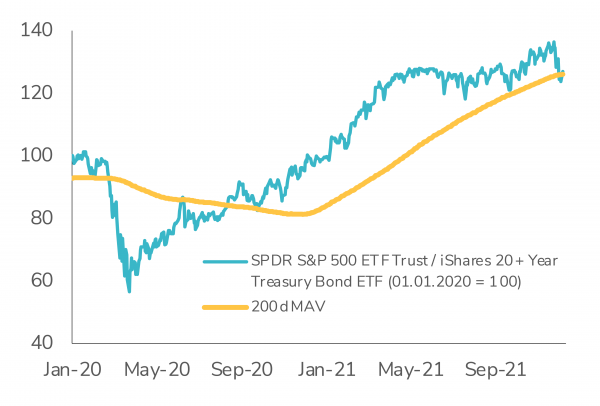
For the coming month, we are maintaining a positive bias toward equity allocation. In the current environment of positive economic growth and negative real bond yields, equities remain clearly the most attractive asset class. Looking at the relative strength of equities (S&P 500) versus long-term bonds (US 20 year+ Treasuries), the trend remains intact as the 200 days moving average support has been successfully tested early December. Still, the risk of a correction is increasing with central banks becoming less dovish and lofty valuations. As such, we are adding some protections to the portfolios. We believe that our agile tactical asset allocation process will help us navigate through a more volatile and uncertain market environment.
From a regional point of view, we continue to maintain a preference for Eurozone equities (strong earnings growth and valuations in-line with historical average). Eurozone Banks look attractively valued, with relative P/E multiples still at lows.
We also have a preference on Japan on the basis of 1) Strong operational leverage (high sensitivity to growth); 2) Weakening yen; 3) Improving macroeconomic growth and; 4) New political leadership.
We are positive on US equities. Valuations are expensive, but the Return on Equity is on aggregate above the rest of the world. From a sector standpoint, we continue to maintain a long-term preference for secular growth story. However, we note that investors are back to paying record high premium for growth stocks relative to value stocks (99th percentile). Valuation spread between expensive and cheap stocks is back to extreme level (98th percentile). Momentum is again becoming increasingly correlated and crowded with Growth stocks (81st percentile).
We also note a very strong divergence in performance between large-caps and small-caps and this might offer some stock picking opportunities.
We stay cautious on China equities as we believe that slowing growth and regulatory crackdown will continue to weigh on sentiment.
FIXED INCOME ALLOCATION
Downgrading US government bonds
On the back of the flattening of the long end of the US yield curve, we are turning even more negative on rates and US government bonds (from cautious to disinclination). We believe that inflation pressures and monetary policy normalization should lead to upward risks on long term rates. We still have a preference for EUR Core curve over USD Curve due to more pressure on EUR growth, more support from the ECB and unfavorable technical in the US. We remain cautious on the whole credit spectrum due to valuation (very tight spreads). We would consider a sell-off in US High Yield as a buying opportunity. We remain positive on subordinated debt. The segment looks mature and resilient and continue to offer some premiums while the current environment is still favorable to banks. We remain positive on Emerging Markets debt as the sell-off is offering more attractive valuation. We continue to like Asian High Yield as opportunities abound during the current sell-off.
COMMODITIES
Still cautious and keep exposure to Gold
We remain cautious on commodities. While the asset class is enjoying its best year since the oil crash in 1973, we believe the recent bull run is overbought and being be somewhat driven by panic rather than pure fundamentals. We start to see some commodities segments (e.g. industrial segments) being impacted by lower growth prospects in China. We keep an exposure to Gold. The upside of the yellow metal still depends on how much lower US real rates can go. But it was encouraging to finally see some firming recently as investors are looking for some diversifiers in their multi-asset portfolios.
FOREX
Bullish dollar
Momentum/tactical drivers continue to support the short term momentum in favor of the US dollar even if the additional potential may now be limited (economic growth differential, economic surprise differential, changes in the real interest rate differential). However, long-term fundamentals for the US dollar are more challenging (current account and public deficit outlook) Macroeconomic drivers still plead for a firm CHF over the medium term but the USD benefits from the current environment. UK stagflation risk weights on GBP short term prospects.
Tactical Positioning: Our Asset Allocation Matrix
Disclaimer
This marketing document has been issued by Bank Syz Ltd. It is not intended for distribution to, publication, provision or use by individuals or legal entities that are citizens of or reside in a state, country or jurisdiction in which applicable laws and regulations prohibit its distribution, publication, provision or use. It is not directed to any person or entity to whom it would be illegal to send such marketing material. This document is intended for informational purposes only and should not be construed as an offer, solicitation or recommendation for the subscription, purchase, sale or safekeeping of any security or financial instrument or for the engagement in any other transaction, as the provision of any investment advice or service, or as a contractual document. Nothing in this document constitutes an investment, legal, tax or accounting advice or a representation that any investment or strategy is suitable or appropriate for an investor's particular and individual circumstances, nor does it constitute a personalized investment advice for any investor. This document reflects the information, opinions and comments of Bank Syz Ltd. as of the date of its publication, which are subject to change without notice. The opinions and comments of the authors in this document reflect their current views and may not coincide with those of other Syz Group entities or third parties, which may have reached different conclusions. The market valuations, terms and calculations contained herein are estimates only. The information provided comes from sources deemed reliable, but Bank Syz Ltd. does not guarantee its completeness, accuracy, reliability and actuality. Past performance gives no indication of nor guarantees current or future results. Bank Syz Ltd. accepts no liability for any loss arising from the use of this document.


.png)
