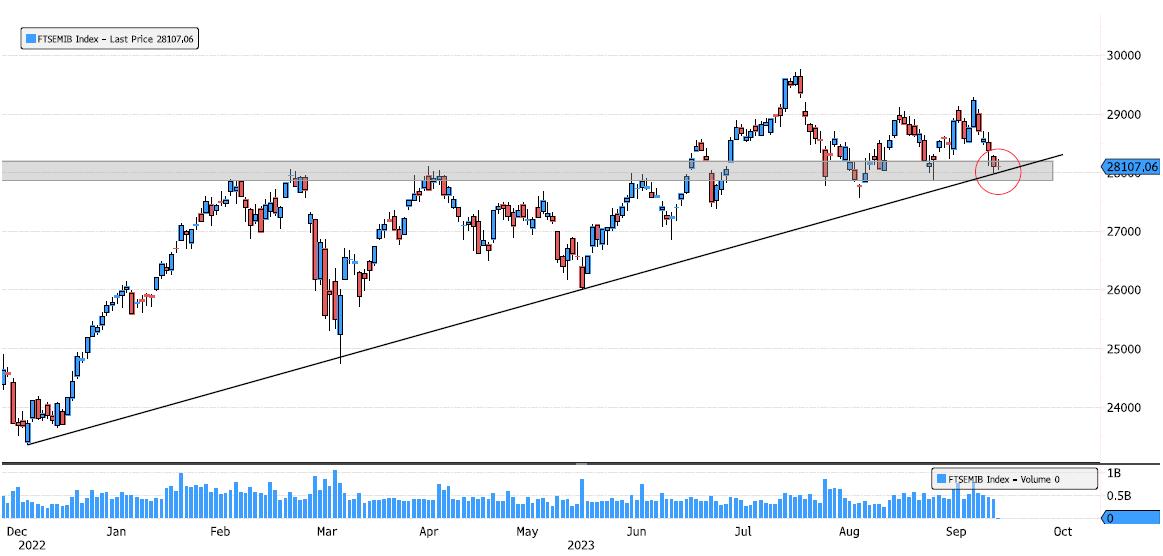
FTSE MIB Index testing double support
Disclaimer
This marketing document has been issued by Bank Syz Ltd. It is not intended for distribution to, publication, provision or use by individuals or legal entities that are citizens of or reside in a state, country or jurisdiction in which applicable laws and regulations prohibit its distribution, publication, provision or use. It is not directed to any person or entity to whom it would be illegal to send such marketing material. This document is intended for informational purposes only and should not be construed as an offer, solicitation or recommendation for the subscription, purchase, sale or safekeeping of any security or financial instrument or for the engagement in any other transaction, as the provision of any investment advice or service, or as a contractual document. Nothing in this document constitutes an investment, legal, tax or accounting advice or a representation that any investment or strategy is suitable or appropriate for an investor's particular and individual circumstances, nor does it constitute a personalized investment advice for any investor. This document reflects the information, opinions and comments of Bank Syz Ltd. as of the date of its publication, which are subject to change without notice. The opinions and comments of the authors in this document reflect their current views and may not coincide with those of other Syz Group entities or third parties, which may have reached different conclusions. The market valuations, terms and calculations contained herein are estimates only. The information provided comes from sources deemed reliable, but Bank Syz Ltd. does not guarantee its completeness, accuracy, reliability and actuality. Past performance gives no indication of nor guarantees current or future results. Bank Syz Ltd. accepts no liability for any loss arising from the use of this document.
Related Articles
After a +20% consolidation from the May 2025 highs, price has done something technically very clean 👇 Swing support at 235.90 was tested at the end of January Clear liquidity sweep below that level, followed by a swift reaction Since then, positive momentum is building Volume expansion right at support → strong signal of institutional interest This kind of price–volume behavior often suggests absorption at key demand, rather than distribution. As long as price holds above the reclaimed support, the structure favors a base-building phase with upside potential. Source: Bloomberg
Bitcoin has consolidated 36% since the October highs, digesting gains in a healthy and structured way. 🔺 Over the past 8 weeks, price action formed a triangle consolidation, now breaking out to the upside 📉 The move successfully tested the major swing support zone at 74’545 – 82’531 📐 Price traded back to the 78.6% Fibonacci retracement, a level often seen in strong continuation trends 🔍 What matters next: ➡️ A weekly close above 96’000 would significantly strengthen the bullish scenario and confirm renewed upside momentum. As always, patience and confirmation remain key at these levels. Source: Bloomberg
After a 42% consolidation since September 2024, Siegfried is starting to show early signs of a trend change. 🔹 The stock successfully tested a major swing support zone at 56.60–70.35, a technically significant area 🔹 Volume is picking up, confirming renewed interest 🔹 A strong +24% move from the lows signals momentum returning ⚠️ That said, chasing the move here would be risky. After such a sharp rebound, patience is key. 👉 Pullbacks toward former resistance / short-term supports could offer much cleaner entry opportunities. This is a name to keep on the radar, not to rush into. Source: Bloomberg


