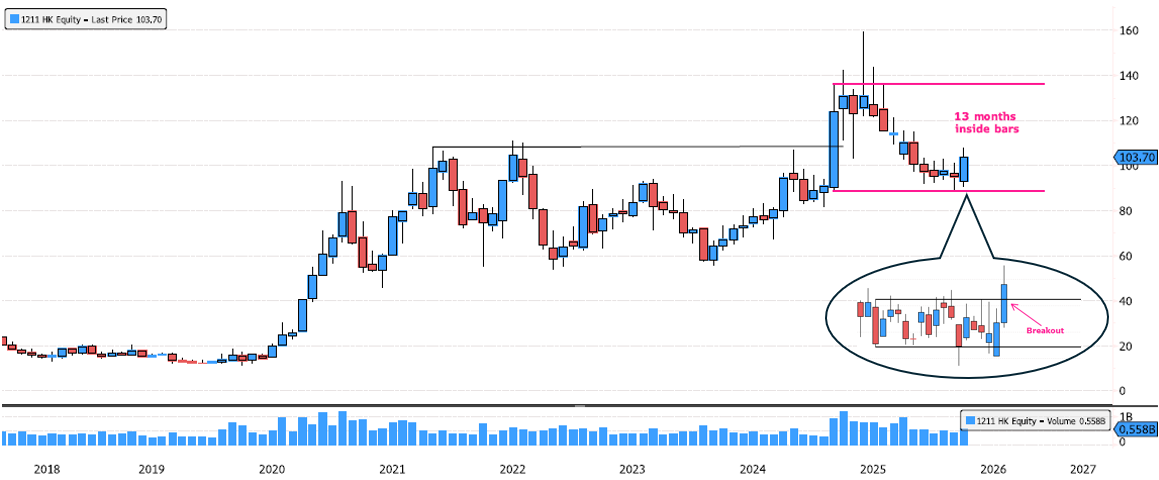
BYD breakout?
The long-term trend remains bullish. Since May 2025, BYD has gone through a 44% consolidation, and the structure is getting very interesting. As shown on the chart, price has formed 13 consecutive inside bars, all within the February 2025 power bar candle. This consolidation has also respected the 88.66 low, which is a key level. What makes this even more significant is that the February 2025 candle was also the breakout from a 4-year sideways consolidation. Now, on the daily chart, we are starting to see a breakout as well — a potentially strong continuation signal 📈 Definitely one to keep on the watchlist. Source: Bloomberg
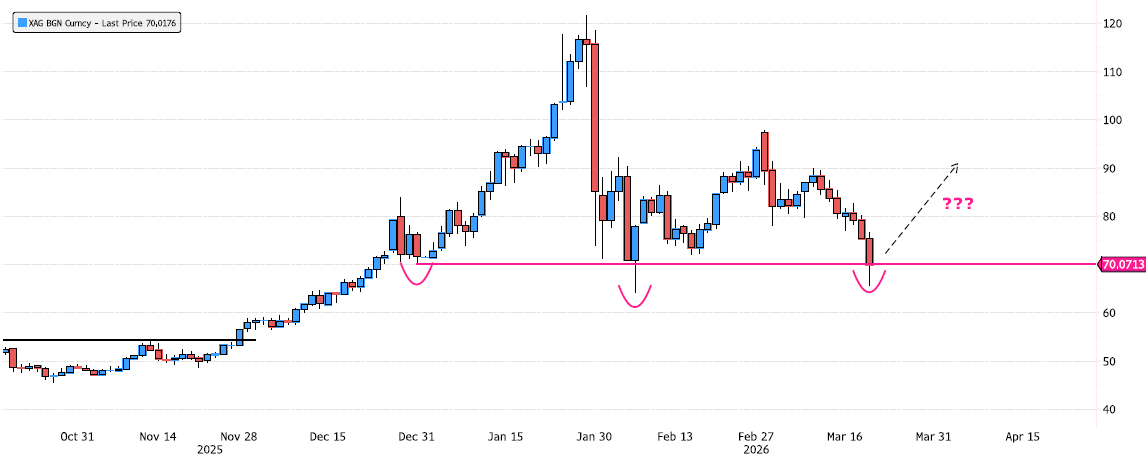
Can Silver hold 70?
Since the beginning of March, Silver is down 33% — a sharp correction that puts pressure on a key level. We are now retesting the major support at 70. The big question: can it hold like last time? On February 6th, we saw a brutal intraday washout down to 64.09 before buyers stepped in. This time, the low so far stands at 65.52 — slightly higher, but still fragile. 📍 Key level to watch: 70 A sustained hold could signal stabilization. A break below could open the door to further downside. Markets are at a decision point. Stay alert. Source : Bloomberg
Bitcoin is starting to show some positive signs
Since October 2025, BTC has been in a 52% consolidation phase. On the surface, the picture may look ugly, especially after the recent break below the major swing low at 74,424. But there is an important nuance. So far, we have only seen one candle break that level and print a new low. Since then, Bitcoin has spent 6 consecutive weeks printing inside bars. That kind of price action can often be interpreted as an accumulation zone rather than outright weakness. The key area Bitcoin is now trying to reclaim is 71,732–74,424. A weekly close back above that range would be the first constructive signal and could suggest that sellers are losing control. The second level to watch is 79,285. A move above that would strengthen the case for a more meaningful recovery. For now, Bitcoin remains at a critical technical juncture: Reclaim 71,732–74,424 = first positive confirmation Break above 79,285 = stronger bullish signal This is definitely a chart worth watching closely in the coming weeks. Source: Bloomberg
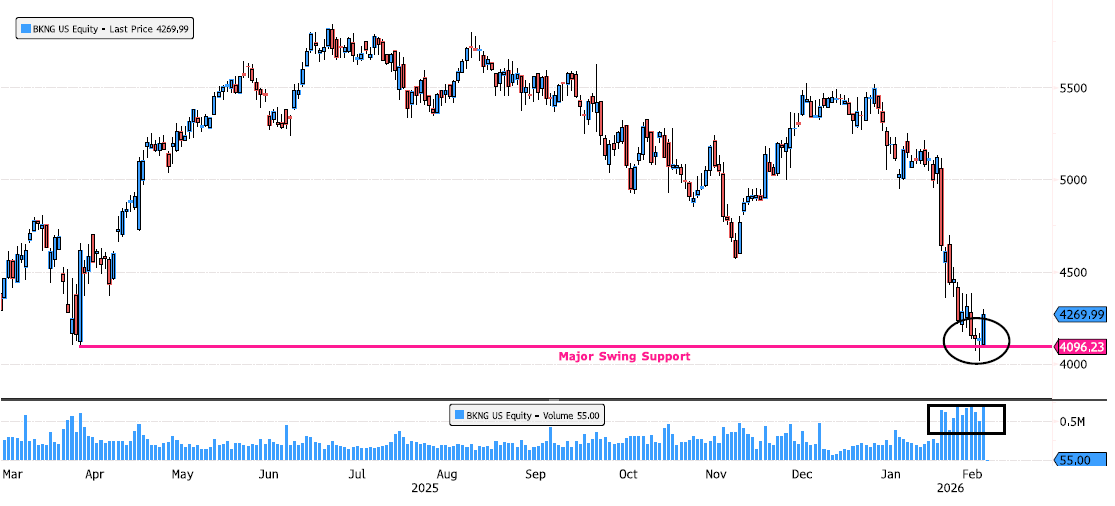
Booking Holdings (BKNG) – Swing Support Holding on Earnings
Booking Holdings (BKNG) rebounding right where it matters — on major swing support during earnings week. After consolidating 31% over the last 32 weeks, the stock has now tested the 4096 key swing level for three consecutive sessions. 👉 Important detail: Price pierced intraday, But never closed below 4096 That tells us institutions were willing to defend the level. Yesterday’s session printed a strong power bar, suggesting demand stepping in at support. Another key observation: Since topping around 5000, volume has been consistently elevated all the way down to the 4100 area. This isn’t a quiet drift lower. This is heavy participation. Now the question becomes: Is this accumulation at support… or just temporary stabilization before another leg down? 📍 Next level to watch: 4438 If price can build momentum and reclaim 4438, that would strengthen the case for a broader rebound and potential shift in short-term structure. Until then, 4096 remains the line in the sand. Source : Bloomberg
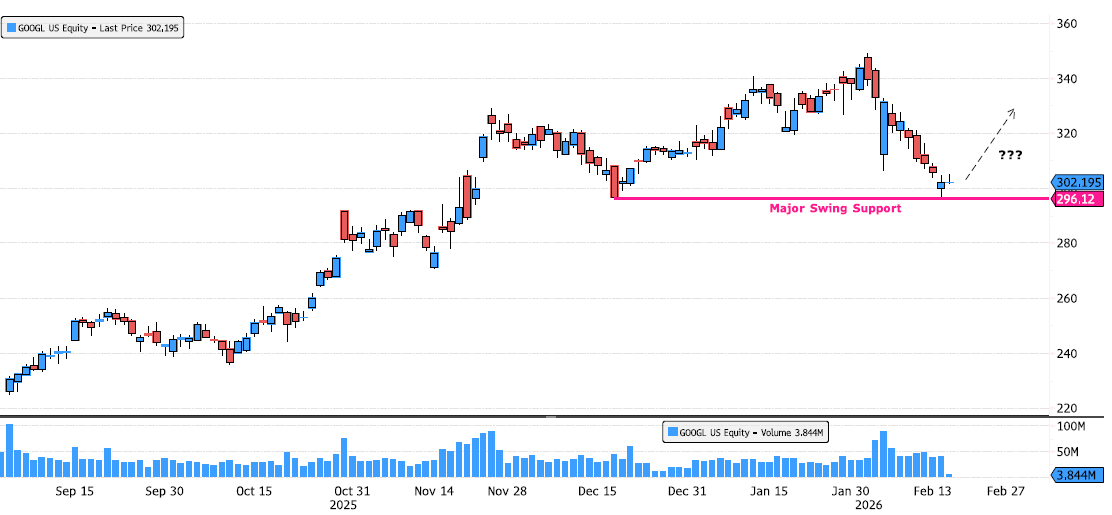
Alphabet Inc. back on swing support
The stock has consolidated roughly 15% since the beginning of February, digesting prior gains and working off overbought conditions. Yesterday’s session saw a rebound right on major swing support at 296.12, with an intraday low at 296.25 — a precise technical reaction that shouldn’t be ignored. It’s still a bit early to call for a confirmed reversal, but this level is clearly one to monitor closely. What would strengthen the bullish case? • 📈 A clear pickup in volume • 🟢 Strong follow-through candles off support • 🔁 Higher lows on lower timeframes • 💥 Reclaiming short-term moving averages If buyers step in with conviction, this zone could mark the start of the next leg higher. If not, a clean break below opens the door to further downside. For now, it’s about watching price + volume confirmation. Are you waiting for confirmation — or positioning early at support? Source: Bloomberg
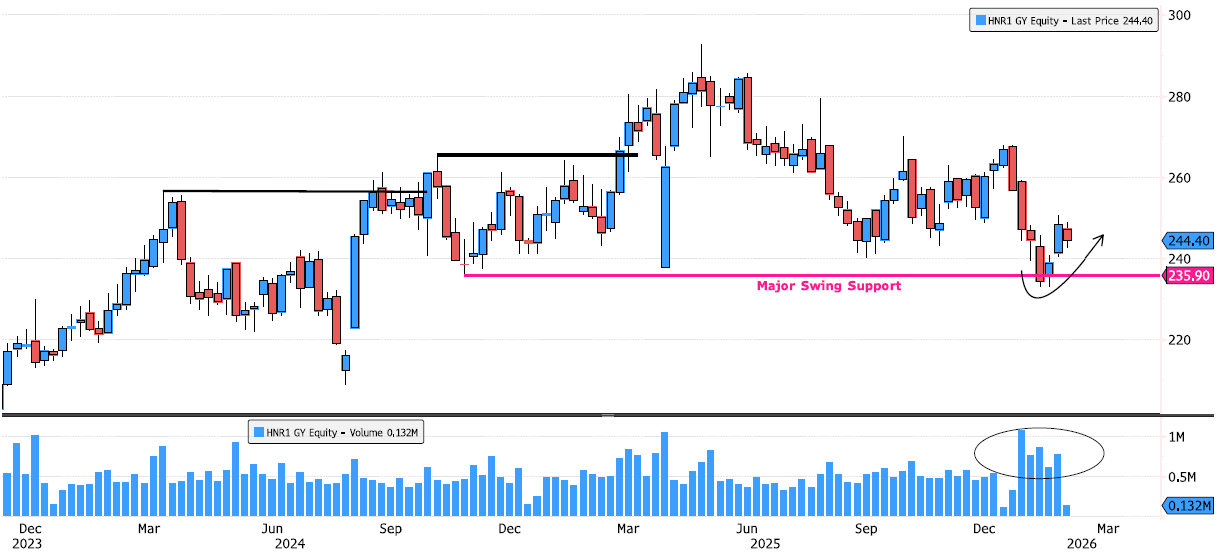
Hannover Rueck reacting on swing support
After a +20% consolidation from the May 2025 highs, price has done something technically very clean 👇 Swing support at 235.90 was tested at the end of January Clear liquidity sweep below that level, followed by a swift reaction Since then, positive momentum is building Volume expansion right at support → strong signal of institutional interest This kind of price–volume behavior often suggests absorption at key demand, rather than distribution. As long as price holds above the reclaimed support, the structure favors a base-building phase with upside potential. Source: Bloomberg
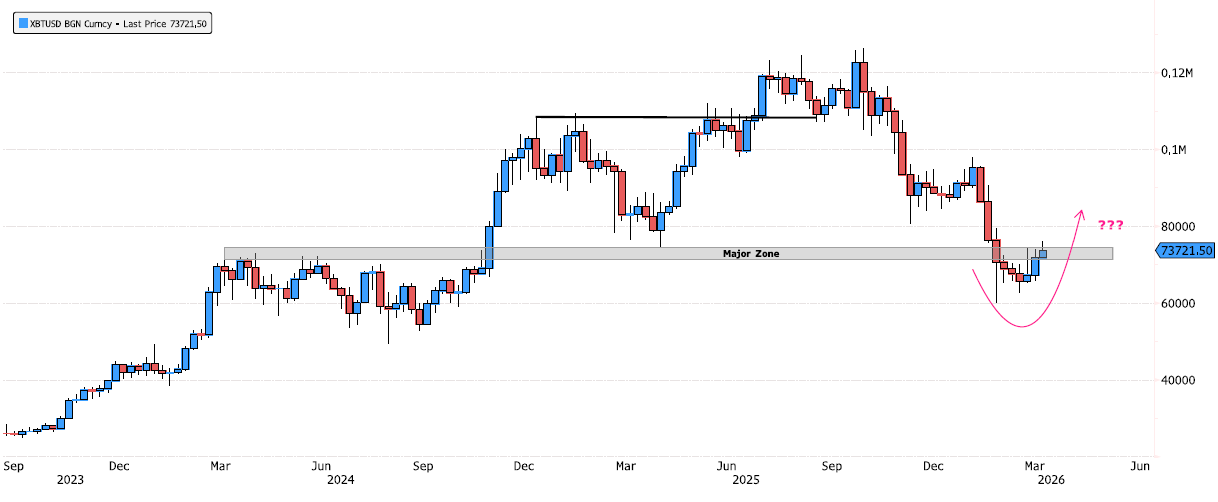
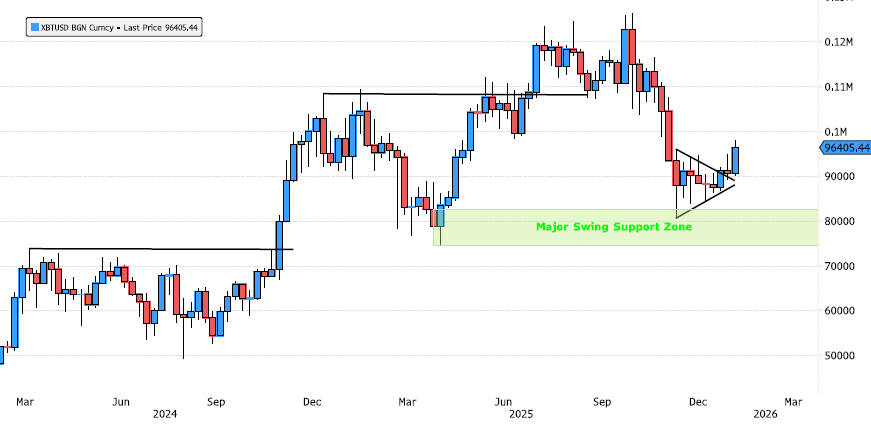
Bitcoin: Breakout After a 36% Consolidation – Strength Building Up
Bitcoin has consolidated 36% since the October highs, digesting gains in a healthy and structured way. 🔺 Over the past 8 weeks, price action formed a triangle consolidation, now breaking out to the upside 📉 The move successfully tested the major swing support zone at 74’545 – 82’531 📐 Price traded back to the 78.6% Fibonacci retracement, a level often seen in strong continuation trends 🔍 What matters next: ➡️ A weekly close above 96’000 would significantly strengthen the bullish scenario and confirm renewed upside momentum. As always, patience and confirmation remain key at these levels. Source: Bloomberg
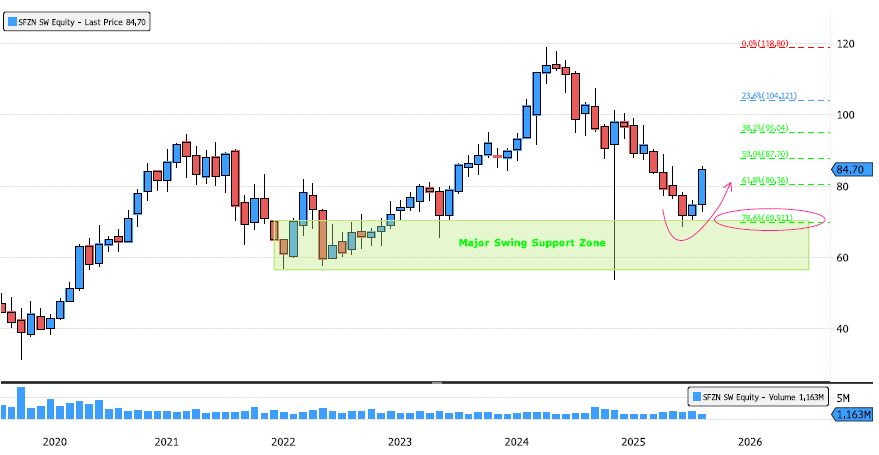
Siegfried Holding rebounding from a major long-term level
After a 42% consolidation since September 2024, Siegfried is starting to show early signs of a trend change. 🔹 The stock successfully tested a major swing support zone at 56.60–70.35, a technically significant area 🔹 Volume is picking up, confirming renewed interest 🔹 A strong +24% move from the lows signals momentum returning ⚠️ That said, chasing the move here would be risky. After such a sharp rebound, patience is key. 👉 Pullbacks toward former resistance / short-term supports could offer much cleaner entry opportunities. This is a name to keep on the radar, not to rush into. Source: Bloomberg