Straight from the Desk
Syz the moment
Live feeds, charts, breaking stories, all day long.
- All
- equities
- United States
- Macroeconomics
- Food for Thoughts
- markets
- Central banks
- Fixed Income
- bitcoin
- Asia
- europe
- investing
- geopolitics
- gold
- technical analysis
- Commodities
- Crypto
- AI
- Technology
- nvidia
- ETF
- earnings
- Forex
- china
- Real Estate
- oil
- banking
- Volatility
- energy
- magnificent-7
- apple
- Alternatives
- emerging-markets
- switzerland
- tesla
- United Kingdom
- Middle East
- assetmanagement
- amazon
- microsoft
- russia
- ethereum
- ESG
- meta
- Industrial-production
- bankruptcy
- Healthcare
- Turkey
- Global Markets Outlook
- africa
- Market Outlook
- brics
- performance
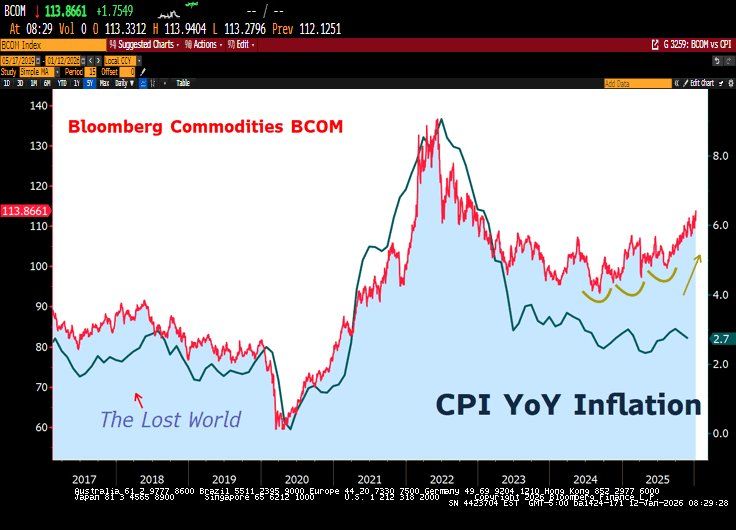
The Divergence of Commodities and Consumer Inflation (2017–2026)
Source: Lawrence McDonald, Bloomberg
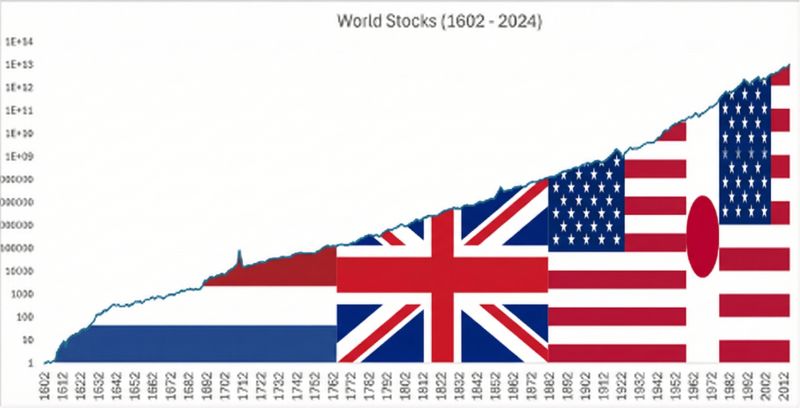
Largest stock market in the world at the time
not always U-S-A... Source: Meb Faber
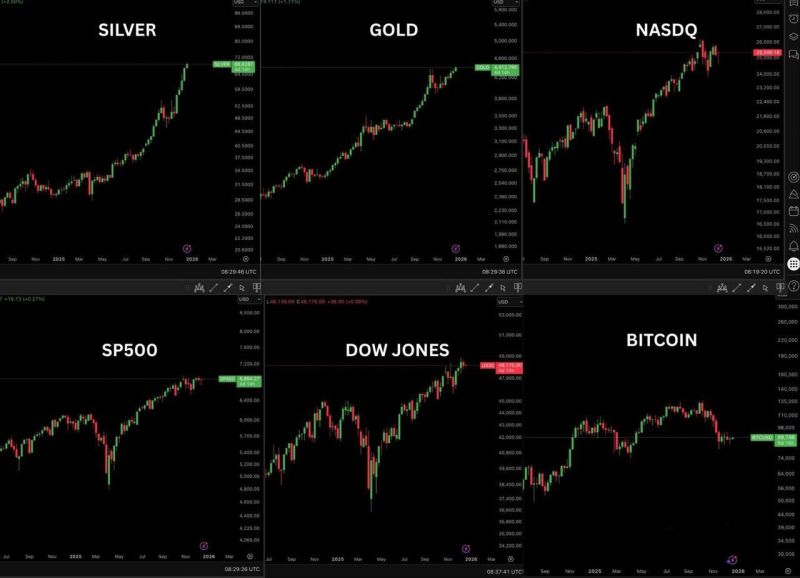
Market manipulation on Bitcoin
GOLD - new ATH SILVER - new ATH S&P 500 - near ATH NASDAQ - near ATH DOW - new ATH While Bitcoin is down -28% from its peak, having the worst Q4 in the last 7 years without any negative news, FUD, or scandal. There is no explanation for this except pure market manipulation. Source: Bull Theory @BullTheoryio
Investing with intelligence
Our latest research, commentary and market outlooks


