Straight from the Desk
Syz the moment
Live feeds, charts, breaking stories, all day long.
- All
- equities
- United States
- Macroeconomics
- Food for Thoughts
- markets
- Central banks
- Fixed Income
- bitcoin
- Asia
- europe
- investing
- geopolitics
- gold
- technical analysis
- Commodities
- Crypto
- AI
- Technology
- nvidia
- ETF
- earnings
- Forex
- china
- Real Estate
- oil
- banking
- Volatility
- energy
- magnificent-7
- apple
- Alternatives
- emerging-markets
- switzerland
- tesla
- United Kingdom
- Middle East
- assetmanagement
- amazon
- microsoft
- russia
- ethereum
- ESG
- meta
- Industrial-production
- bankruptcy
- Healthcare
- Turkey
- Global Markets Outlook
- africa
- Market Outlook
- brics
- performance
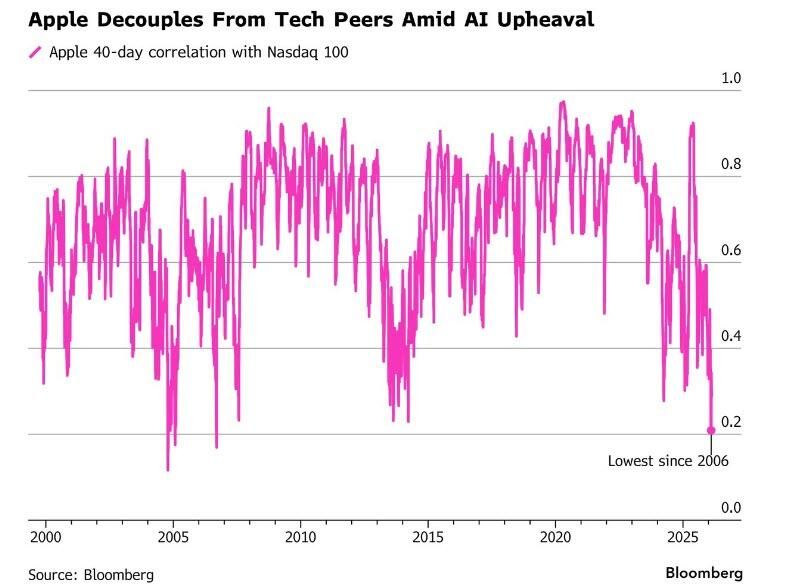
Apple’s 40-day correlation to the Nasdaq 100 Index tumbled to 0.21 last week, the lowest since 2006, according to data compiled by Bloomberg.
Its correlation with the benchmark has been on the decline since May, when it reached 0.92, as Apple’s decision to mostly sit out the AI arms race has turned it into an outlier compared with many of its rivals. Source: zerohedge
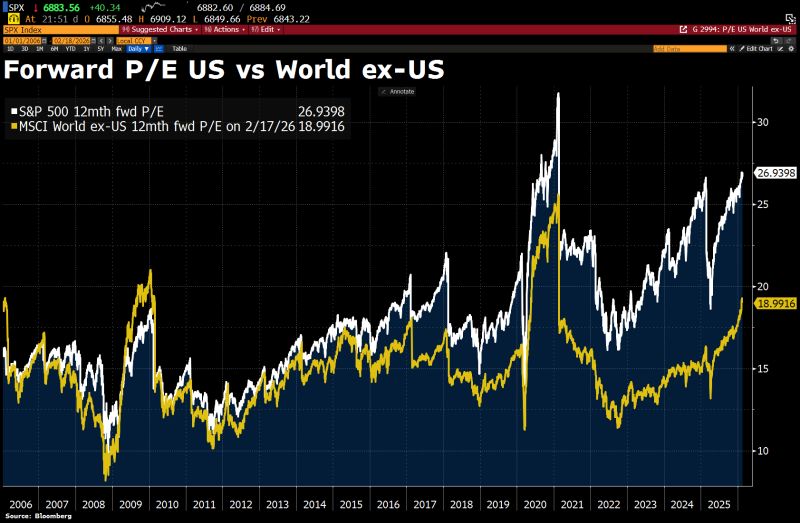
Although global markets have narrowed the gap with the US in recent weeks, US equities still trade at a roughly 40% valuation premium to the rest of the world.
That premium could shrink further if big tech companies lose their capital-light appeal due to rising capex and begin to be valued more like capital-intensive businesses. Source: HolgerZ, Bloomberg
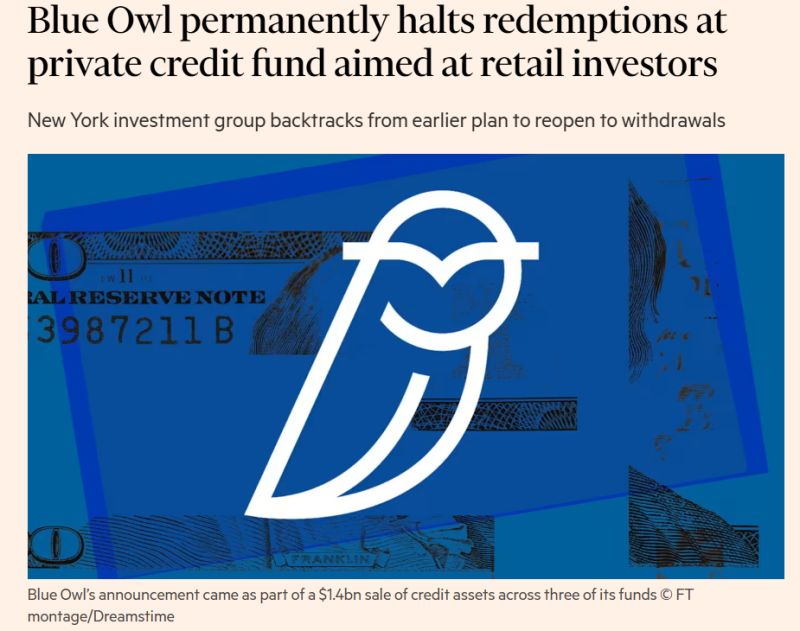
Blue Owl permanently halts redemptions at private credit fund aimed at retail investors
Blue Owl Capital Corp II (OBDC II) has halted regular withdrawals from its retail debt fund, shifting to "episodic payments" after redemptions surged 20% in early 2025. The firm sold $1.4B of assets at near-par to manage liquidity, highlighting strong underwriting despite fund pressures. The case shows that illiquid private loans in retail structures carry risks, and liquidity is crucial when markets tighten. Source: FT
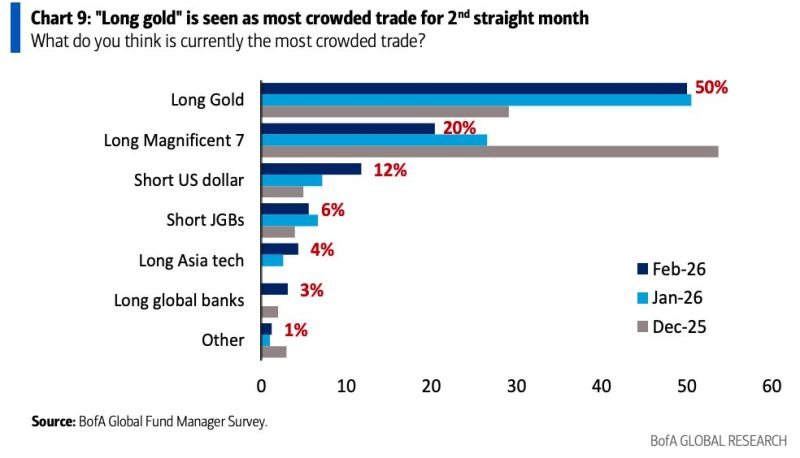
Long gold is by far the most overcrowded trade according to the latest BofA fund manager survey
Source: BofA Global Fund Manager Survey
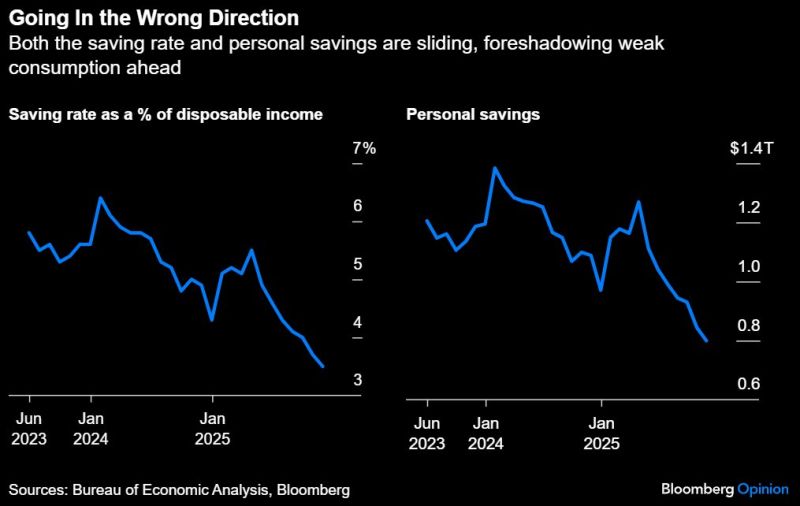
The K-Shaped Economy: Personal savings have dropped by -$469.2 billion since April, a decline of -37%.
The personal saving rate tumbled from 5.5% in April to 3.5% in November, the lowest since 2008, excluding the Covid-era distortions of 2020. Dwindling savings mean there’s less of a cushion to meet necessary payments, let alone make discretionary purchases. Delinquency rates on loans ranging from mortgages to credit cards rose to 4.8% in Q4, the highest since 2017. American's wallets are hurting. Source: Bloomberg, Hedgeye
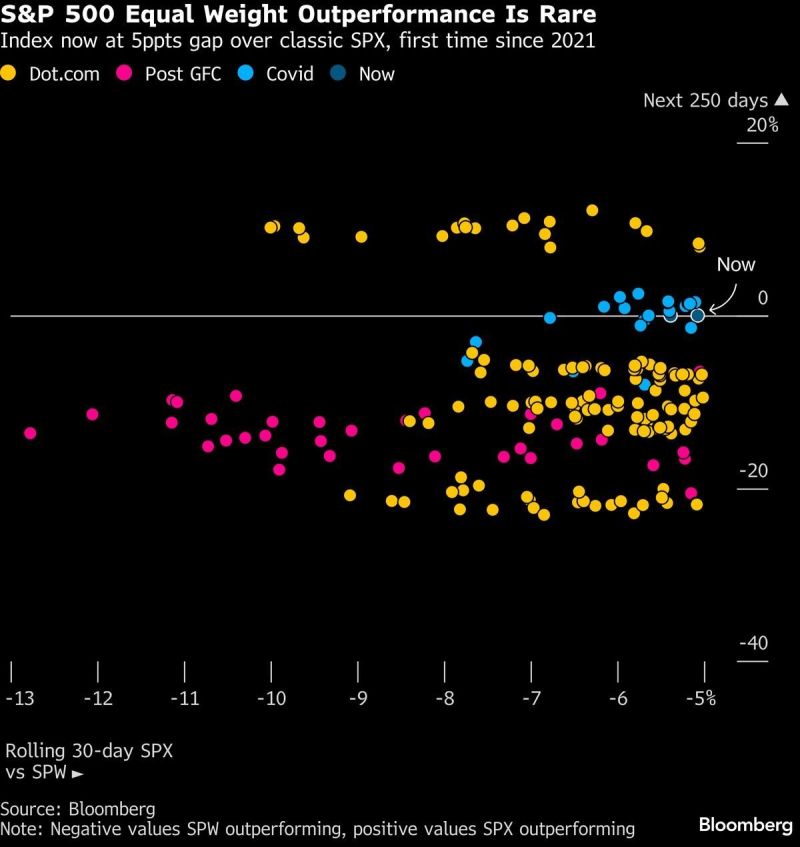
Fascinating study from Bloomberg: S&P Equal Weight outperformance was extremely rare historically:
1999-2002 Dotcom 2009 Post GFC 2020-2021 Covid “Those cases accompanied major shifts in the market.” “Equal-weight S&P managed to maintain some outperformance 250 days later.” “The big question: whether this is the start of an extended period of sharp moves around AI disruptors, and the disrupted.” Source: Macrocharts, Bloomberg
Investing with intelligence
Our latest research, commentary and market outlooks


