Straight from the Desk
Syz the moment
Live feeds, charts, breaking stories, all day long.
- All
- equities
- United States
- Macroeconomics
- Food for Thoughts
- markets
- Central banks
- Fixed Income
- bitcoin
- Asia
- europe
- investing
- geopolitics
- technical analysis
- gold
- Commodities
- Crypto
- AI
- Technology
- nvidia
- ETF
- earnings
- Forex
- china
- Real Estate
- oil
- banking
- Volatility
- energy
- magnificent-7
- apple
- Alternatives
- emerging-markets
- switzerland
- tesla
- United Kingdom
- Middle East
- assetmanagement
- amazon
- microsoft
- russia
- ethereum
- ESG
- meta
- Industrial-production
- bankruptcy
- Healthcare
- Turkey
- Global Markets Outlook
- africa
- Market Outlook
- brics
- performance
THE HOUSING MARKET JUST WOKE UP
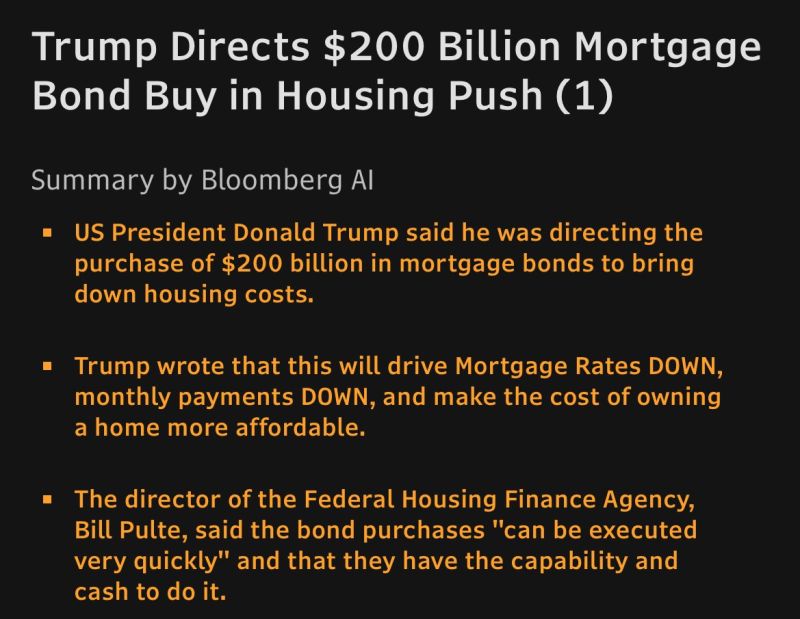
The U.S. housing market is showing a sharp revival, driven by a 28.5% surge in mortgage activity last week. Triggered in part by President Trump’s plan for Fannie Mae and Freddie Mac to buy $200 billion in mortgage-backed bonds, the 30-year fixed rate briefly dipped below 6%, fueling demand. Refinances jumped 40% week-over-week (up 128% vs. last year), while total applications soared as long-idle borrowers finally acted. Economists note this reflects pent-up demand rather than just temporary post-holiday noise, signaling a potential broader market rebound. Is the sub 6% era back for good, or is this a temporary window? Source: CNBC
Is Trump launching his own QE? Buying MBS via Fannie and Freddie…
Source: Bloomberg, Geiger Capital
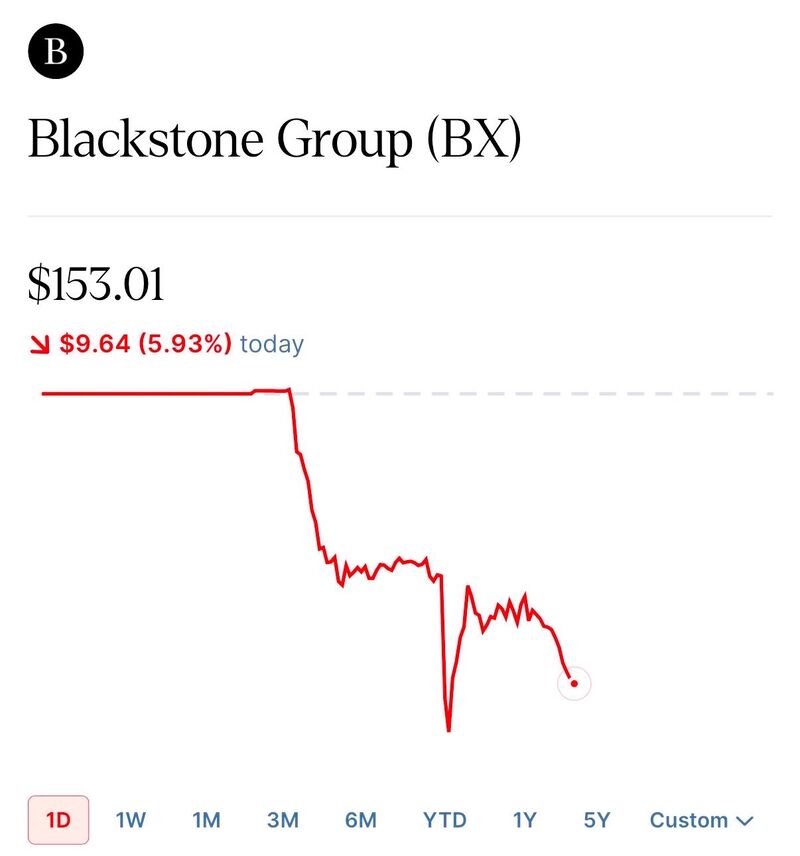
President Trump announces steps to ban large institutional investors from buying single-family homes.
"People live in homes, not corporations." Blackstone shares are tumbling. Source: Brew markets
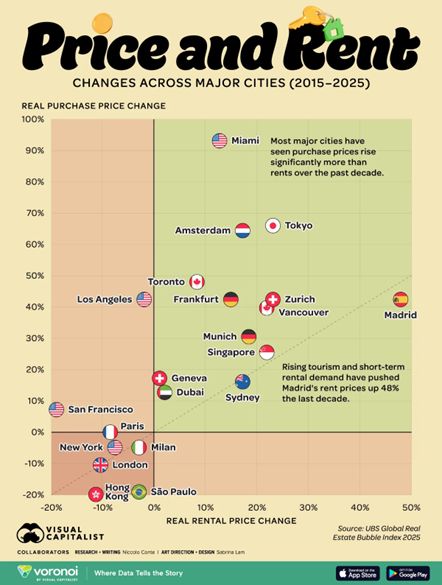
The global real estate map has been completely rewritten in the last 10 years. 🌍🏠
The gap between buying and renting isn't just growing—it’s exploding. The latest data from the UBS Global Real Estate Bubble Index (2015–2025) reveals a massive divergence. If you’re an investor, homeowner, or renter, you need to see these numbers: 🚀 The Rocket Ship: Miami Miami is in a league of its own. Real home prices have skyrocketed by 93.1%. Compare that to a modest 12.7% rent increase. The "Magic City" is officially the world's capital for capital appreciation. 🇪🇸 The Rental Crisis: Madrid While most of the world watches home prices, Madrid is seeing a rental surge like no other. Home Prices: +42.4% Rent Prices: +48.0% This is the steepest rental hike of any major global city, fueled by a massive tourism rebound and a booming short-term rental market. 📉 The Cooling Giants: London & Milan Not every "safe haven" stayed safe. London: Prices and rents have both dropped 10.5% since 2015. Between Brexit's shadow and a significant millionaire exodus, the luster is fading. Milan: A quiet decline, with property values down 4.9% and rents down 3%. 🥨 The Stability Zone: Zurich & Munich German-speaking hubs remain engines of growth. Both saw double-digit increases across the board: Zurich: +42.4% (Home) | +23.1% (Rent) Source: Visual Capitalist, Voronoi, UBS
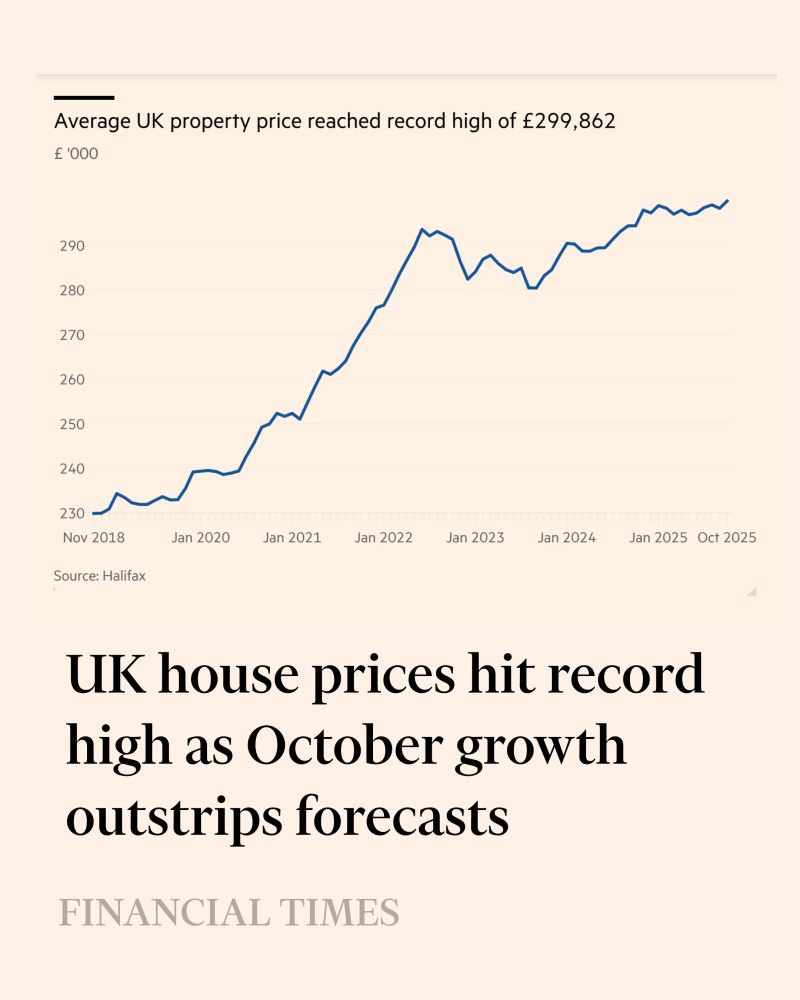
UK house prices rose at the fastest rate last month since January.
Source: Financial Times
China Sept. used home prices -0.64% m/m; drop faster than Aug.
China Sept. new home prices -0.41% m/m; drop faster than Aug. China's largest asset by a factor of 2 continues to disintegrate... Source: zerohedge, GS
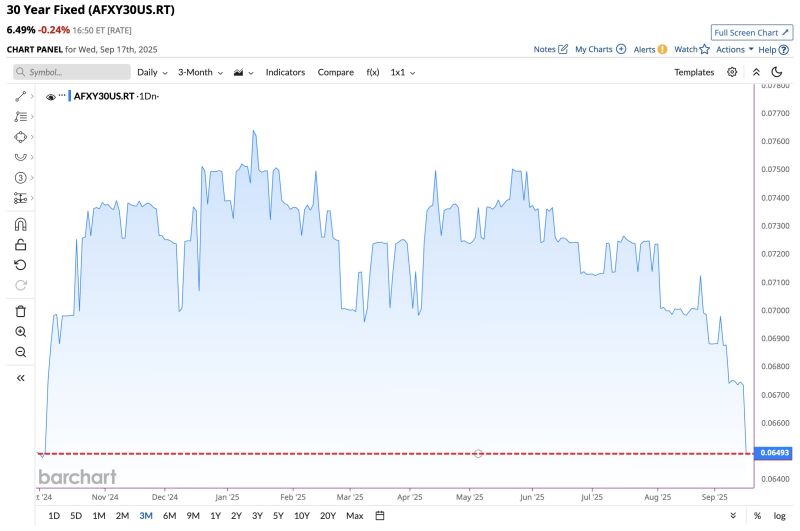
In case you missed it... 30-Year US Mortgage Rate plunges to 6.49%, the lowest level in almost 12 months
Source: Barchart
Investing with intelligence
Our latest research, commentary and market outlooks


