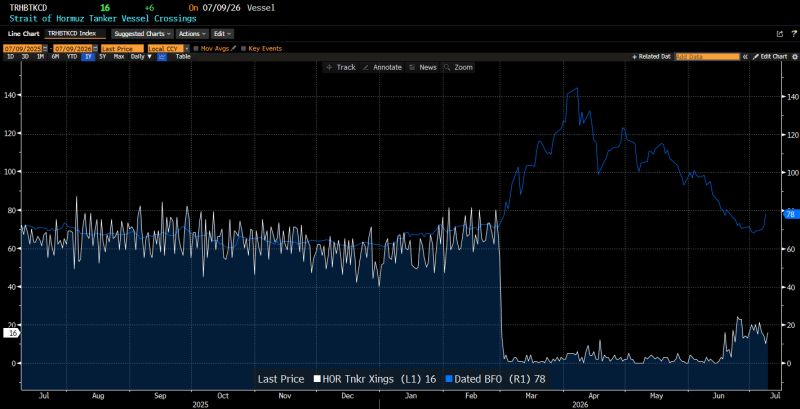
Strait of Hormuz 🇮🇷 oil crossings (in white) have not recovered, yet oil prices (in blue) are near the levels they were pre-war.
Source: Gordon Johnson
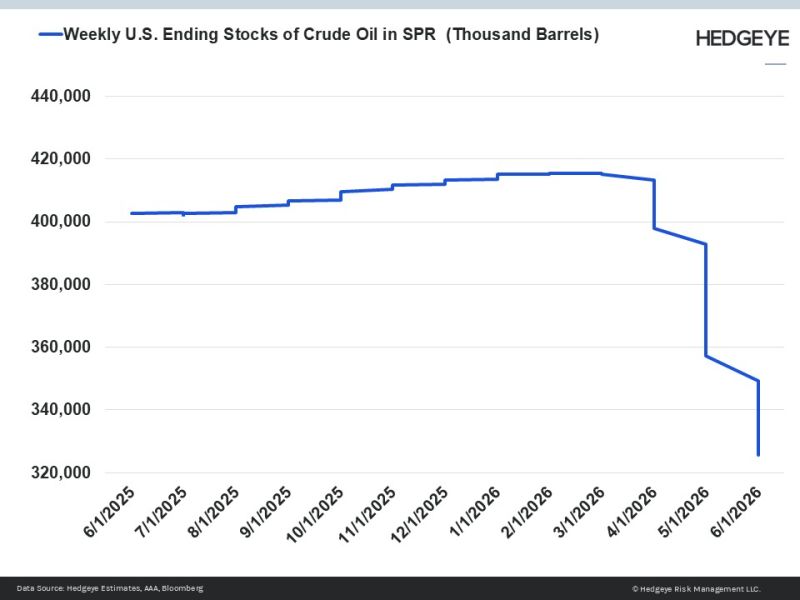
U.S. Strategic Petroleum Reserve (SPR) stocks fall to 43-year low
Source: Hedgeye
Saudi Arabia cut the price of its main crude grade for Asian customers, effective August, amid weakening demand and easing tensions.
It's the largest reduction in over two decades. The sharp price cut comes as pressure grows on the world's largest crude exporter, as softer demand in Asia coincides with improving supply conditions following the easing of geopolitical tensions in the Middle East.Source: The Times Of India
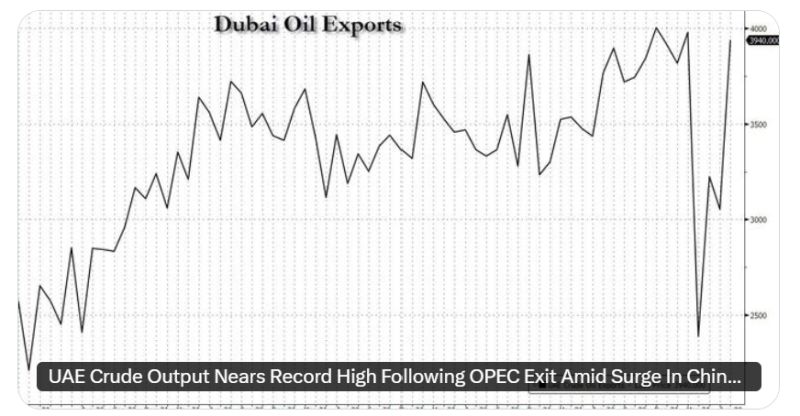
UAE Crude Output Nears Record High Following OPEC Exit Amid Surge In Chinese Buying
Source: zerohedge
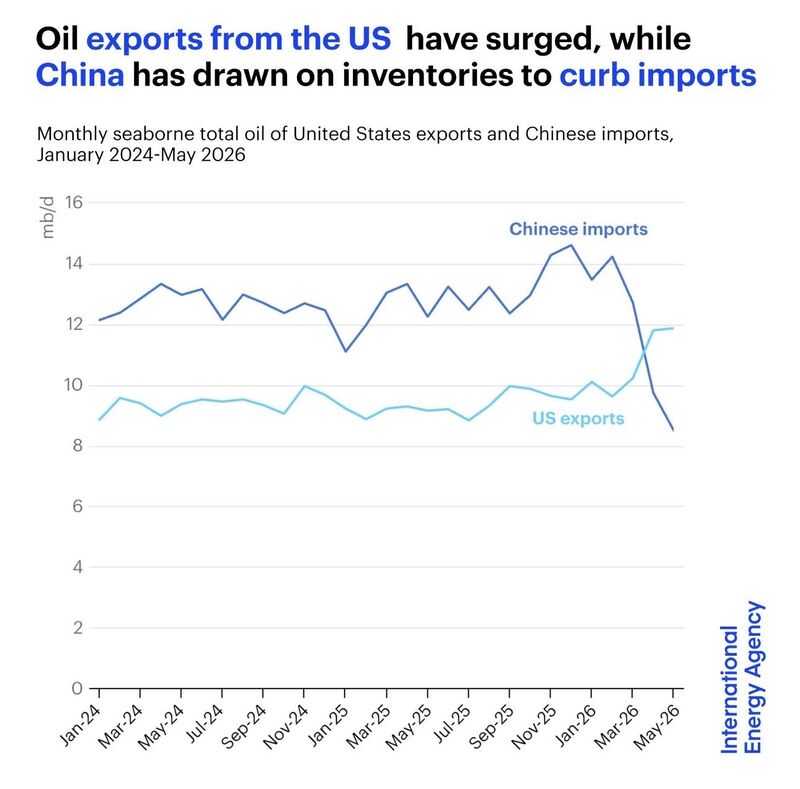
One chart may have just revealed a major shift in the global energy order.
For the first time in history, U.S. oil exports have surpassed China's crude oil imports. At first glance, it looks like just two lines crossing on a chart. In reality, it could mark a profound structural change. For two years, China's crude imports hovered around 12–14 million barrels per day. Then they suddenly plunged to roughly 8.5 million. At the same time, U.S. oil exports, long stuck around 9–10 million barrels per day, surged above 12 million. Why? China didn't stop buying oil because demand disappeared. It stopped because supply became constrained. • Nearly 38% of China's crude imports depended on the Strait of Hormuz. • Gulf producers faced major disruptions. • Russia was already exporting at full capacity. • U.S. light sweet crude isn't an ideal substitute for many Chinese refineries. With few alternatives, China began drawing down strategic inventories instead of importing. That collapse in imports isn't necessarily a sign of weaker demand. It may be evidence of a country relying on its emergency reserves to navigate one of the biggest supply shocks in years. Meanwhile, U.S. exporters stepped in to replace part of the missing Gulf supply. Sometimes, the most important geopolitical shifts don't make the front page. They simply appear when two lines cross on a chart. Source. Jack Prandelli on X, IEA
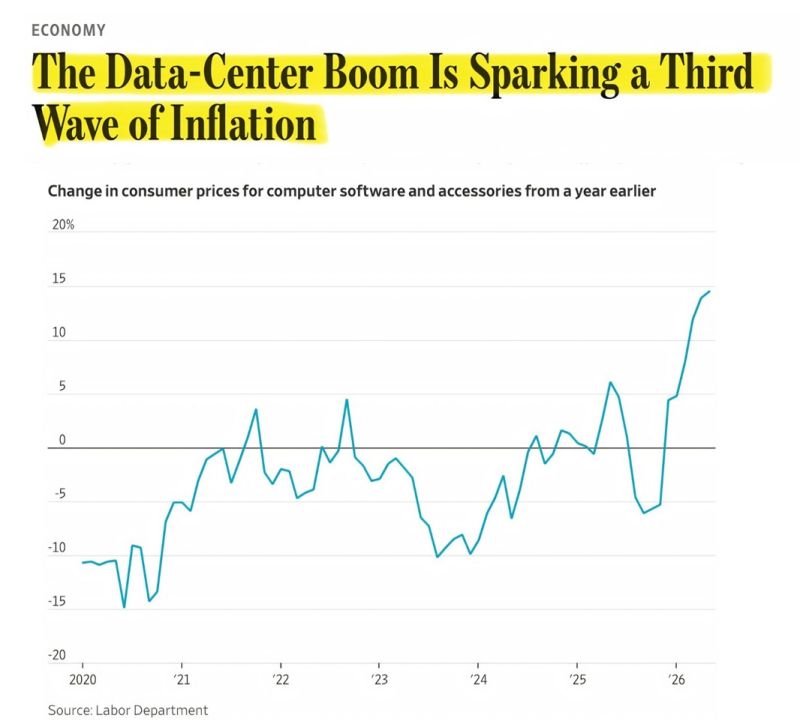
AI MAY BE TRIGGERING THE THIRD WAVE OF INFLATION.
Even Tim Cook recently said the current cost pressures are unlike anything he's seen in more than 40 years in the business. The first inflation wave came from supply chain disruptions. The second was driven by tariffs and energy prices. But this third wave could be different. Tariffs can be negotiated. Oil prices eventually fall as supply catches up. AI infrastructure spending doesn't work that way. This isn't a temporary supply shock. It's a massive demand shock that's still in its early stages. The five largest hyperscalers are expected to spend roughly $741 billion on AI infrastructure this year—up about 75% from last year. Much of that investment hasn't even translated into physical deployments yet. That means today's price pressures may be the beginning, not the peak. Here's why. AI requires enormous amounts of high-bandwidth memory and advanced chips. Those same components are also used in smartphones, laptops, gaming consoles, automobiles, and countless other electronics. As AI companies absorb a growing share of the available supply, they aren't just increasing the cost of AI—they're putting upward pressure on prices across the broader electronics market. We're already seeing signs of that. Apple and Microsoft recently raised prices on products including MacBooks, iPads, and Xbox consoles while pointing to higher component costs and memory constraints. Nintendo and Sony had already announced similar price increases weeks earlier. This isn't one company passing through higher costs. It's an entire hardware industry repricing around the same supply bottleneck. The Federal Reserve's long-term assumption is that AI will eventually offset these inflationary pressures through productivity gains. That may ultimately prove true. But several analysts, including UBS, argue those productivity benefits could take years to fully materialize, while the cost increases are happening today. That leaves the Fed facing a difficult balancing act: keeping interest rates elevated through a period where the technology expected to reduce inflation over the long run may be contributing to higher prices in the short run. If that's the case, this inflation cycle may prove more complex than the tariff- and energy-driven shocks policymakers have dealt with so far. Source: Bull Theory on X
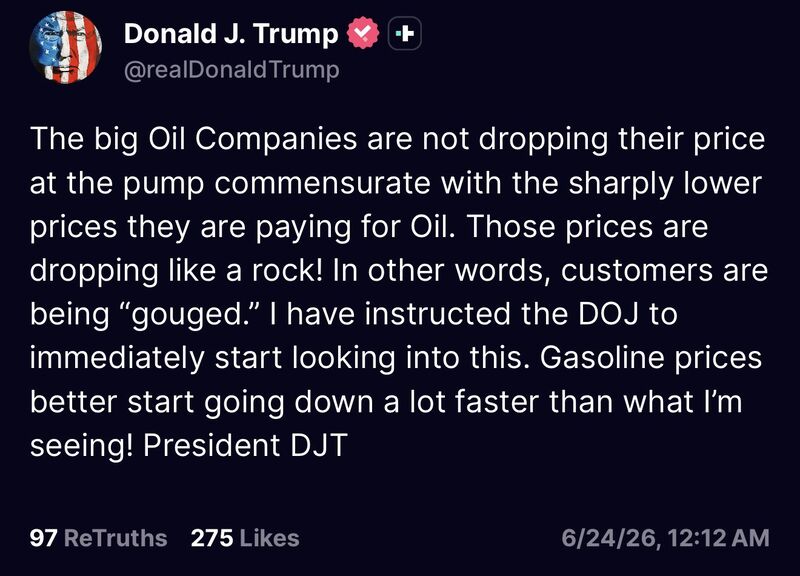
President Trump says he has instructed the DOJ to begin looking into “big Oil Companies” who “are not dropping their price at the pump”
“Customers are being ‘gouged’” he added Source: Trend Spider
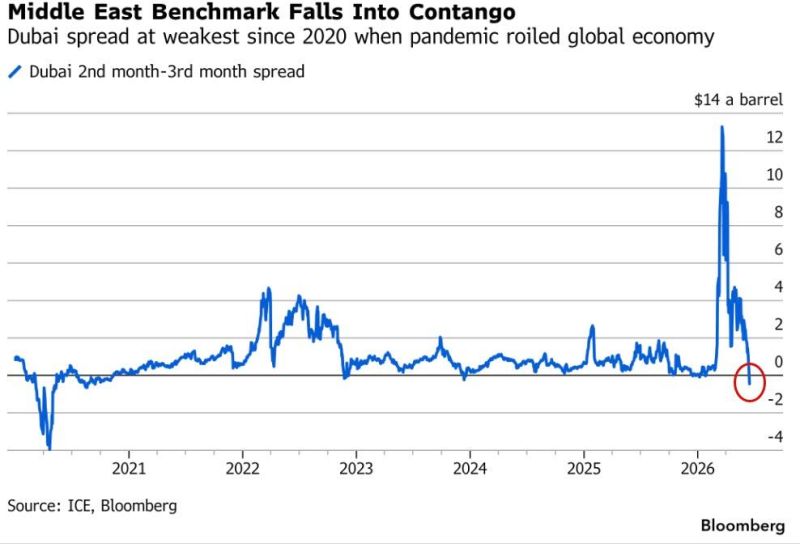
Bloomberg's Michael Ball notes that material flows through Hormuz creates a different problem for crude,
Especially in Asia, as too much supply hits a region that has already adapted to fewer Middle East barrels. Asian refiners replaced disrupted Middle East barrels with US crude and other alternatives, cut some processing runs when prices rose and are now facing a sudden wave of Persian Gulf supply. This has led Middle Eastern crude curves to flip into bearish contango, showing the market is pricing a near-term glut rather than shortage. Source: Bloomberg, zerohedge