Surging Tanker Rates Signal a Deepening Global Energy Crisis
Global tanker freight rates are surging to record levels with little respite in sight, a sign of the growing strain in oil markets as traders, shipowners, producers and buyers grapple with a drawn-out conflict in the Persian Gulf and increasingly complex workarounds. Earnings for supertankers sailing on the benchmark Middle East-to-China route are at a record of nearly $800,000 a day. Meanwhile, for the US Gulf to Asia run, charterers have been offering very large crude carriers at a record lump-sum fee of $29.5 million — close to $15 per barrel without considering additional war risks or fees for unexpected delays. (Bloomberg) Source: Tracy Shuchart (𝒞𝒽𝒾 )

CHINA IS BACK—AND OIL MARKETS ARE FEELING IT
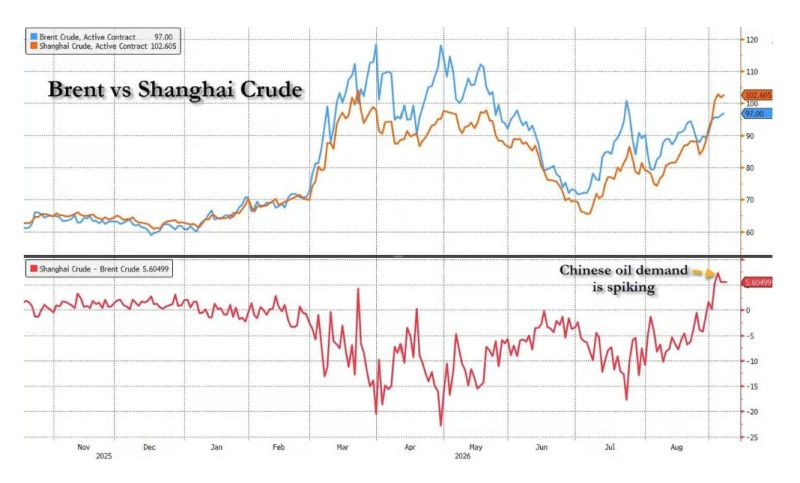
Chinese oil demand has unexpectedly rebounded, pushing Shanghai crude above $100 per barrel and to a significant premium over Brent. That marks a sharp reversal from earlier in 2026, when weak Chinese imports and refining activity helped contain global oil prices. Now, Chinese buyers are aggressively competing for supplies from Africa, Canada and Latin America as Iranian exports collapse and disruption around the Strait of Hormuz persists. Some African crude grades are reportedly trading at premiums of up to $20 over Brent, while Russian ESPO prices are also strengthening. The rebound appears driven by improving refinery margins, renewed fuel exports and inventory restocking—not necessarily a full economic recovery. But the market implication is clear: Brent is approaching $100 Alternative supplies are becoming more expensive Further shipping disruptions could send prices toward $120 China may have just removed one of the biggest brakes on global oil prices. Source: Zerohedge, Bloomberg
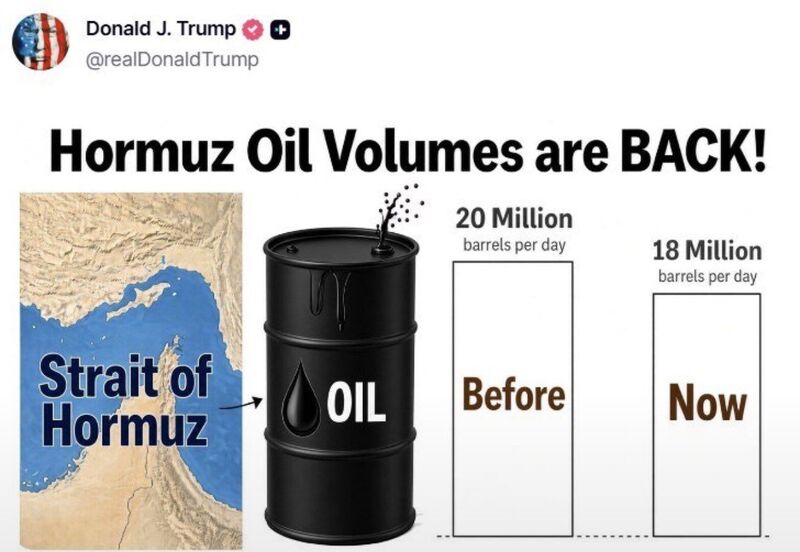
With just 60 days until the US midterms, the pressure on the White House is intensifying.
Diesel at $240 a barrel. Gasoline at $4.10 a gallon. The US 10-year yield at 4.75%. As the economic pain mounts, the President will face growing pressure to do—or say—whatever it takes to bring oil prices down. Source: Brad Moseley
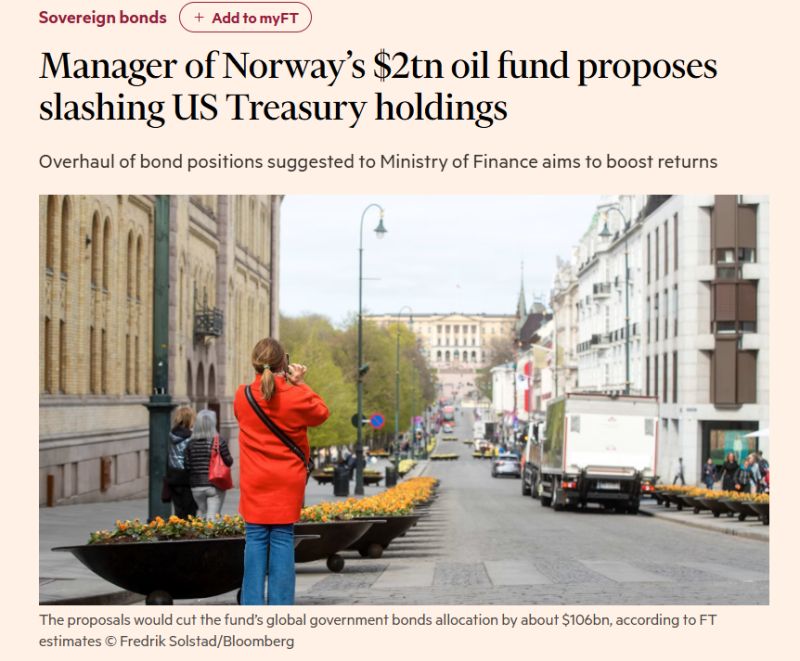
Norway’s $2.3 trillion sovereign wealth fund could be preparing a major shift away from US Treasuries.
Norges Bank Investment Management has proposed cutting government bonds from 70% to 50% of its fixed-income benchmark. The potential impact: • Around $106 billion less in global government debt • An estimated $80 billion reduction in US Treasuries • More capital redirected toward higher-returning areas of the bond market The fund currently invests just under 26% of its assets in fixed income. The timing is significant. Government debt is surging. Inflation risks are returning. And despite repeated US Treasury interventions, long-term yields remain near multiyear highs. This does not mean Norway is abandoning Treasuries. But when one of the world’s largest investors questions the traditional government-bond allocation, markets should pay attention. The message is clear: sovereign debt may no longer offer the risk-return profile it once did. Source: Financial Times
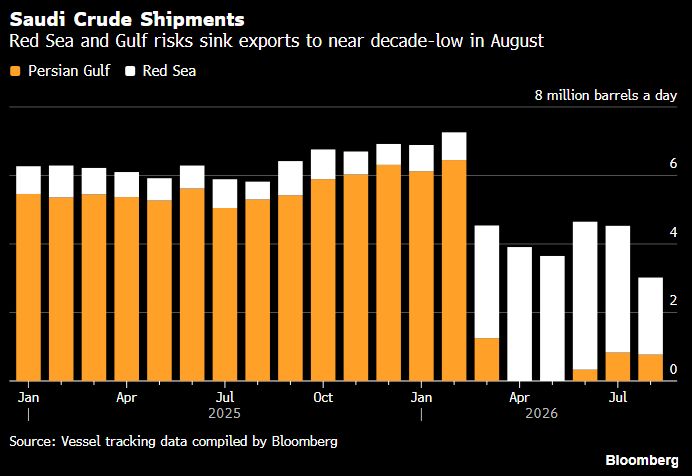
Saudi Crude Shipments
"Saudi Arabia’s observed crude exports last month slumped to the lowest in at least nine years" "The kingdom’s oil exports were about 3 million barrels a day in August" "Saudi ships have come under attack in the Red Sea from Yemen’s Houthi militants". Source: Bloomberg Ziad Daoud
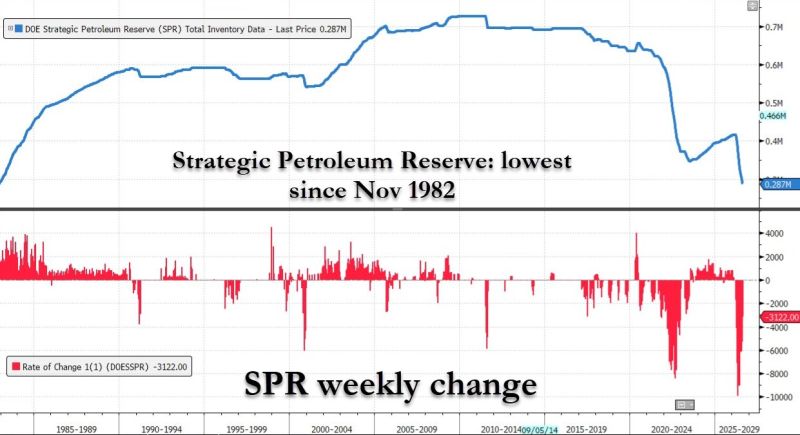
In the US, SPR (Strategic Petroleum Reserve) is at the lowest since 1982
Crude -4.450MM, Exp. +60K Gasoline -1.173MM Distillates +796K Cushing +80K Production 19kb/d SPR down 3.1MM barrels to 287 million, just 17 million away - or one month of drain - from record low.
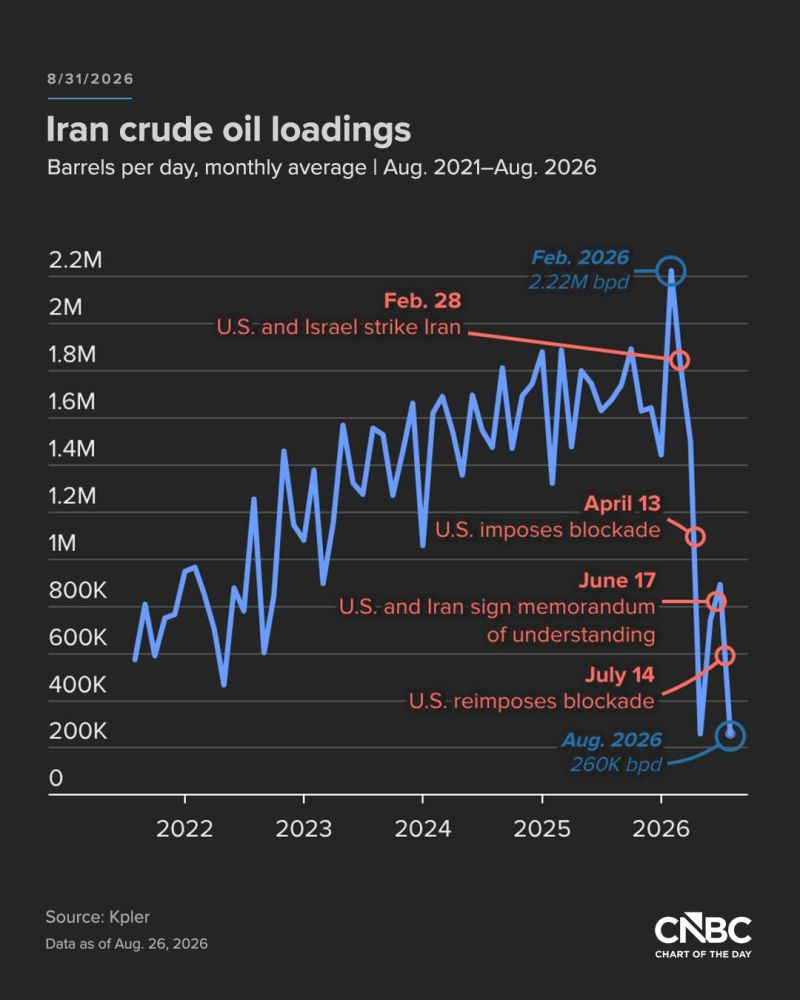
Iranian crude oil exports have plunged in August
The U.S. relies on economic pressure through its naval blockade, rather than military strikes, to coerce Tehran into a deal to fully reopen the Strait of Hormuz. Tehran has loaded about 260,000 barrels per day for export at its ports so far this month, a decline of more than 80% compared with 1.7 million bpd in August 2025, according to data shared Thursday by the trade intelligence firm Kpler. Source: CNBC
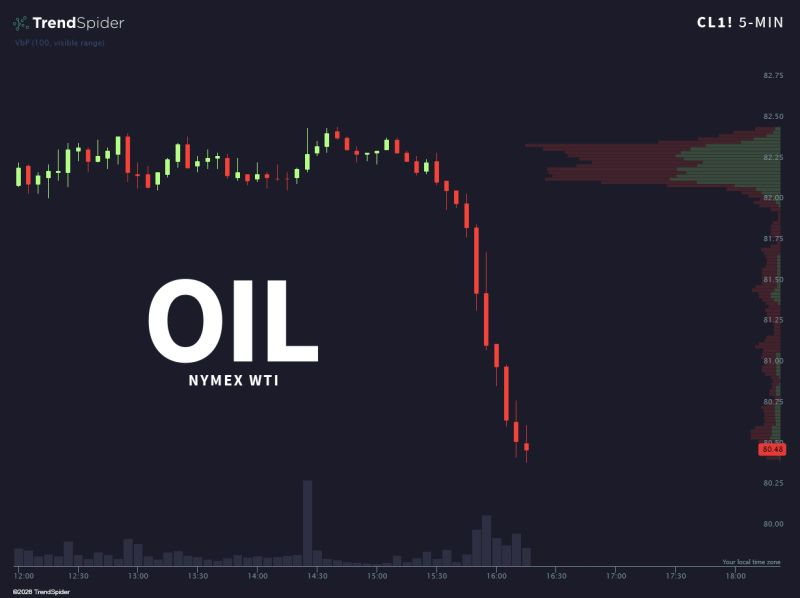
The U.S. and Iran have reportedly reached a ceasefire agreement, according to a Russian news source.
They cite Pakistani and Iranian sources, saying the deal will be announced in the coming days. U.S. oil prices fell on the news. Neither the U.S. nor Iran have confirmed. Source: Trend Spider