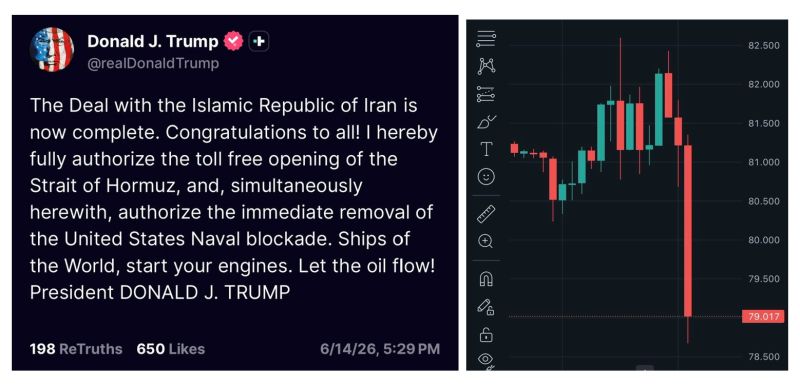
Trump: "The deal is complete (...) Let the oil flow!" Crude oil $WTI is plummeting on Hyperliquid in pre-market open!
After 107 days of war, the US and Iran have now officially reached a peace deal, with the signing set for June 19th in Switzerland.
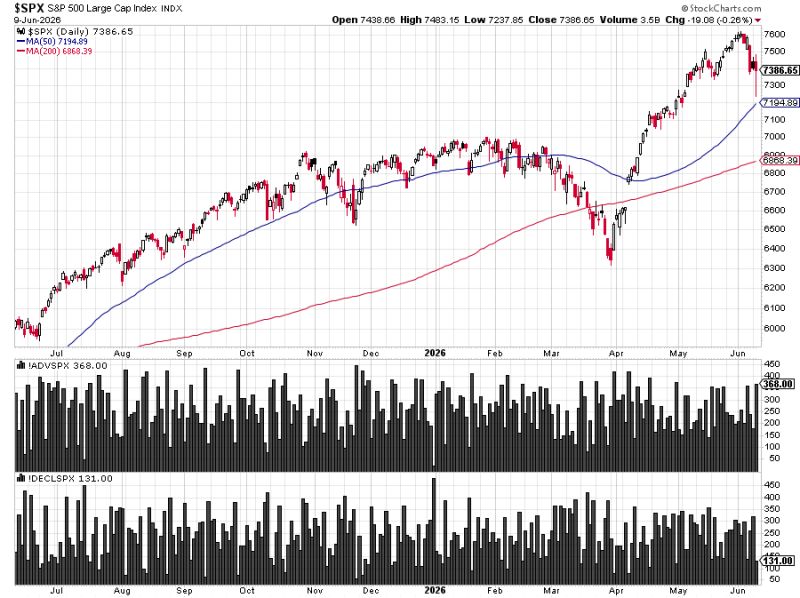
Oil falls. Yields rise. Something has shifted
Oil down 15% in three weeks. The two-year yield up 15bps last week to 4.15% - its highest since early 2025. For the first time in months, US macro is back in the driving seat. Source: Jonny Matthews | SuperMacro
Japan's Crude Oil reserve was built in 1980.
Took 45 years to fill. Took 8 weeks to drain. Source: Rand Group
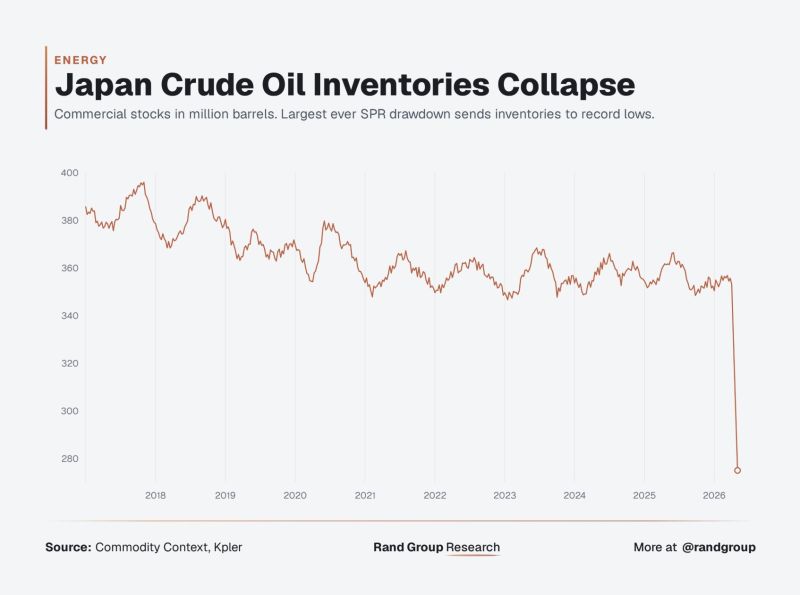
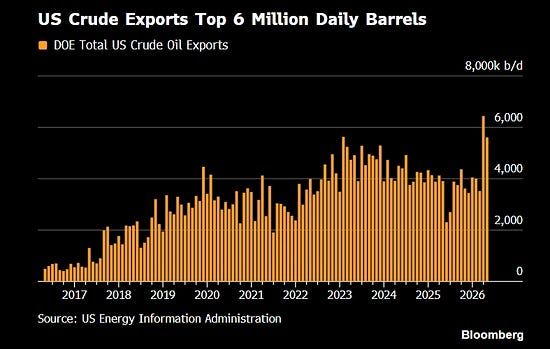
The US is exporting its SPR releases.
Source: Lukas Ekwueme
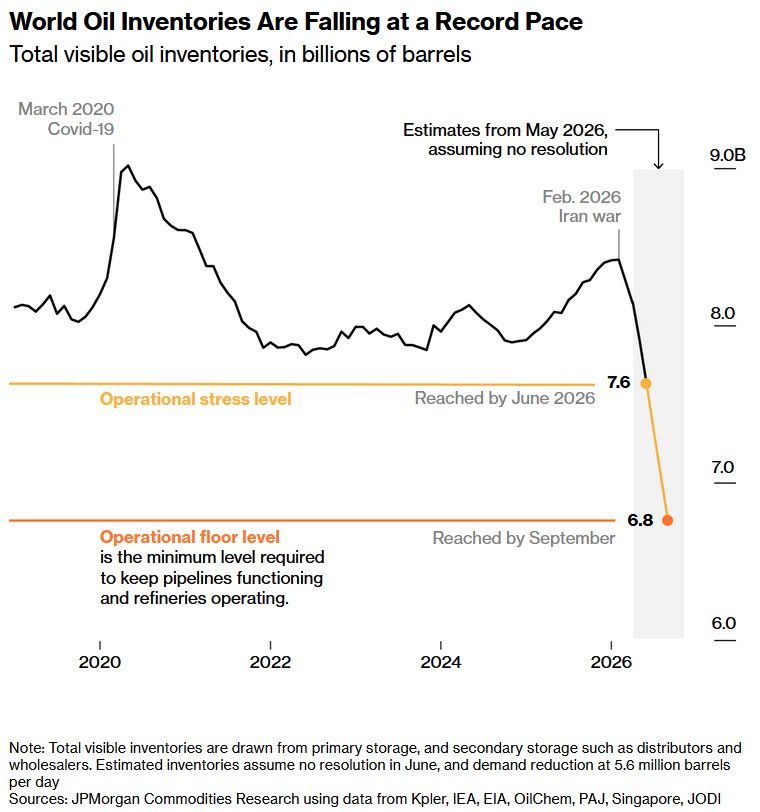
Global oil inventories have fallen to 7.6 billion barrels since the Iran war began
Source: Stocks World
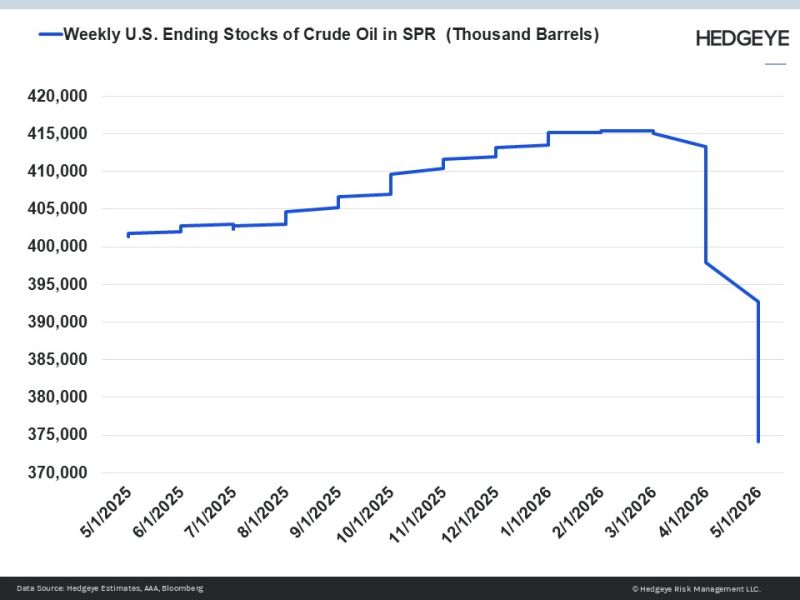
U.S. Strategic Petroleum Reserve (SPR) stocks fall to 2-year low
Source: zerohedge
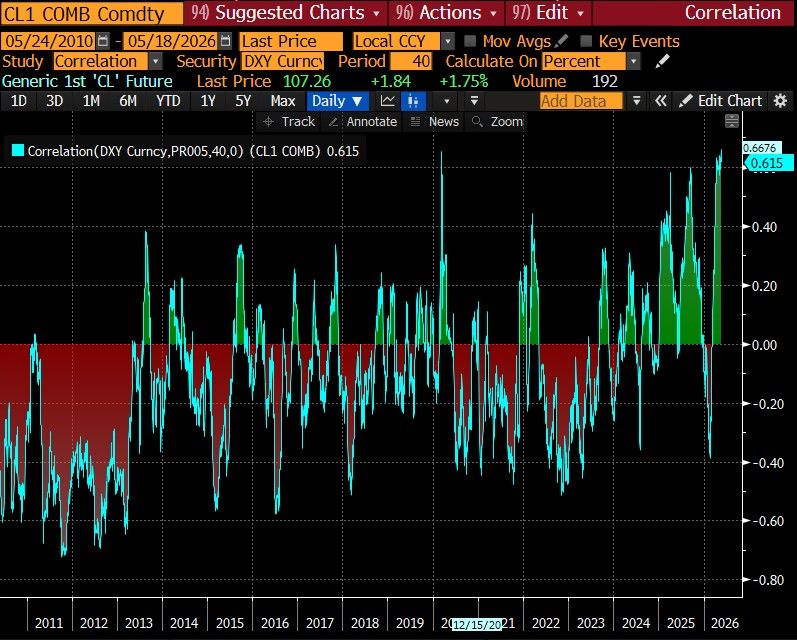
Is there a trade here? Crude and the dollar have never been this positively correlated.
Source: Bloomberg, RBC
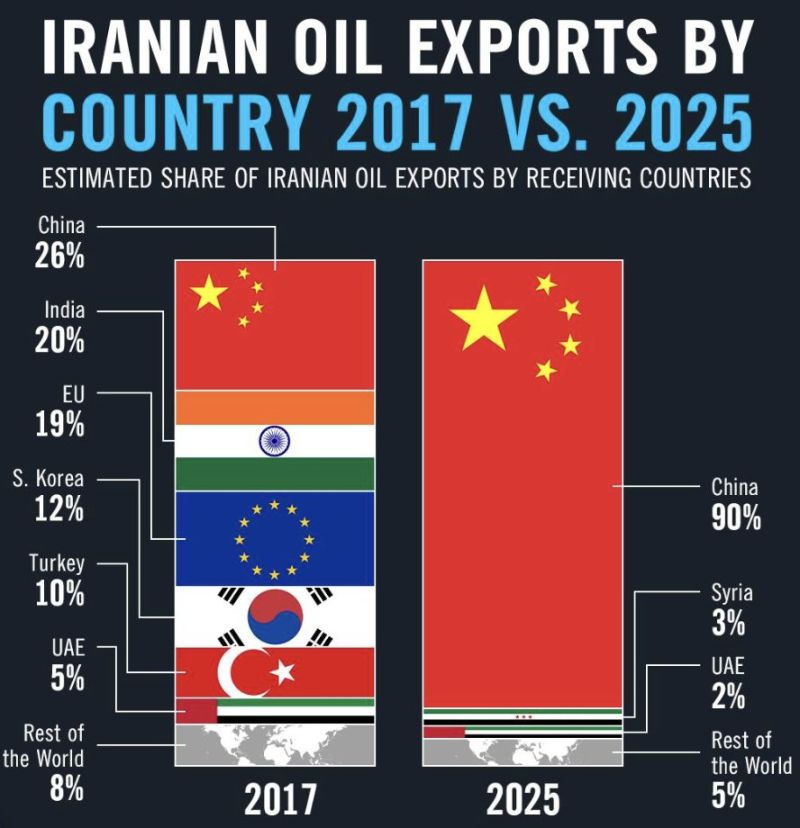
US–China Sanctions Escalation Over Iranian Oil
Jack Prandelli argues that 90% of Iran’s oil exports go to China, prompting a US sanctions escalation aimed at Beijing. The US has built a multi-step pressure strategy including sanctions on shadow fleet vessels, teapot refineries like Hengli Petrochemical, and networks of front companies across Asia. It has also issued warnings to Chinese banks about potential secondary sanctions if Iranian oil payments continue flowing through their systems. Full secondary sanctions on major Chinese banks remain a possible next step, which could significantly escalate US–China financial tensions. Outcome depends on Beijing.