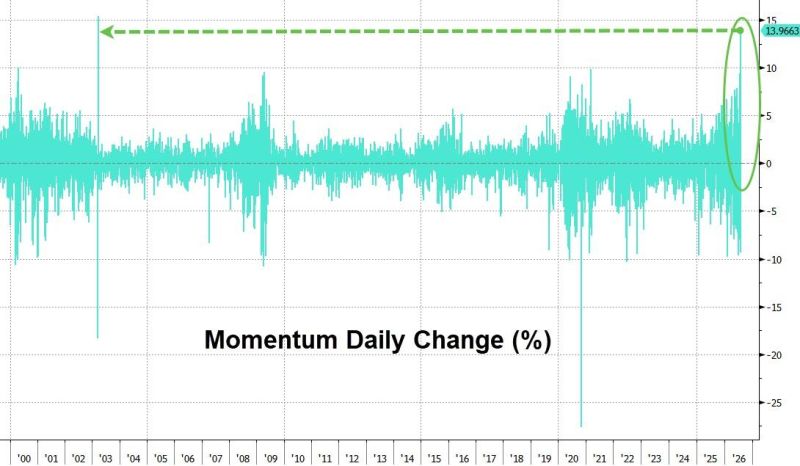
Yesterday saw Momentum's single-biggest daily gain since 2003...
Source: zerohedge
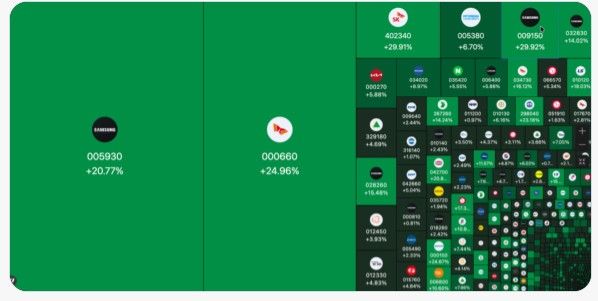
MASSIVE REVERSAL IN SOUTH KOREA
₩720 trillion has been added to Korean market today as KOSPI surged 16%. Samsung is up 20% SkHynix is up 25% Source: The Macro paper
$AMZN Q2 earnings blew past Wall Street's expectations with strong AWS revenue. Stock is up nearly +10% after-hours
Source: Yahoo Finance
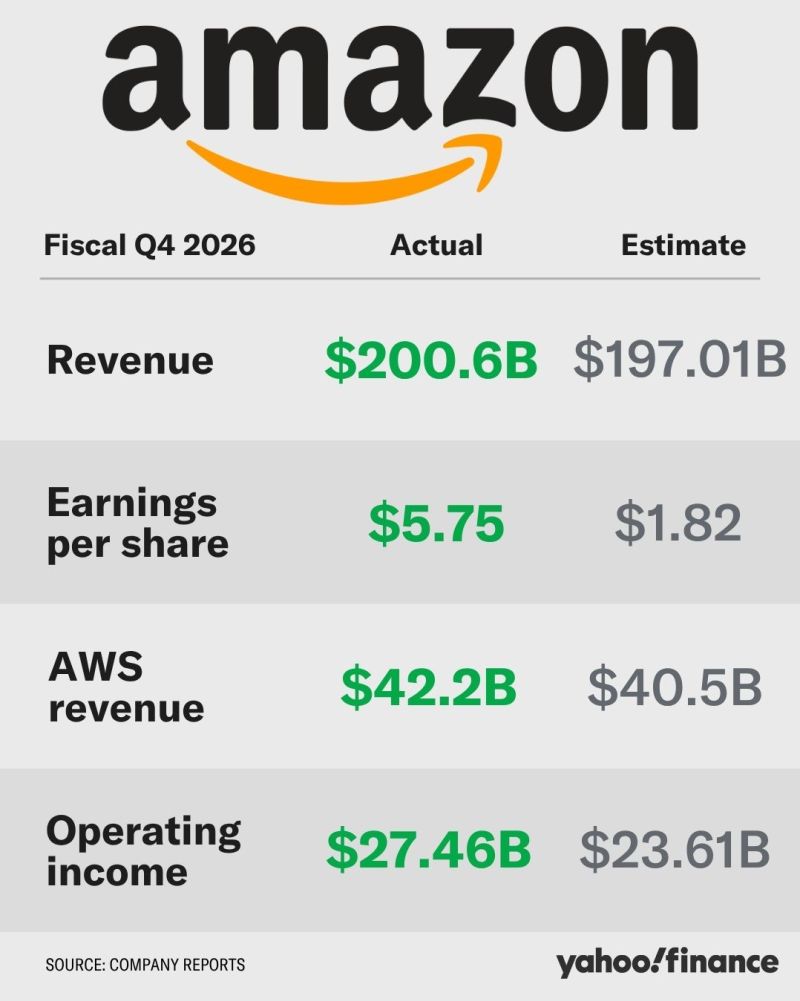
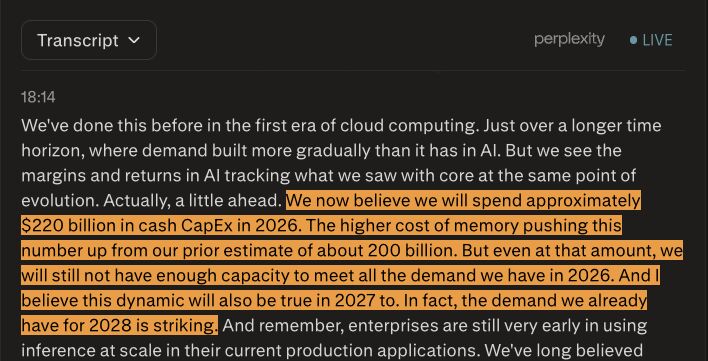
Amazon $AMZN on raising 2026 cash CapEx to $220B:
“The higher cost of memory is pushing this number up from our prior estimate of about $200 billion.” “Even at that amount, we will still not have enough capacity to meet all the demand we have in 2026. I believe this dynamic will also be true in 2027.” “The demand we already have for 2028 is striking.” “We typically purchase servers and networking equipment a few months before putting them into service, so we have strong visibility into customer demand before we trigger the spend.” “If the demand isn’t there, we won’t spend the capital for servers and networking equipment.” Source: Wall ST Engine
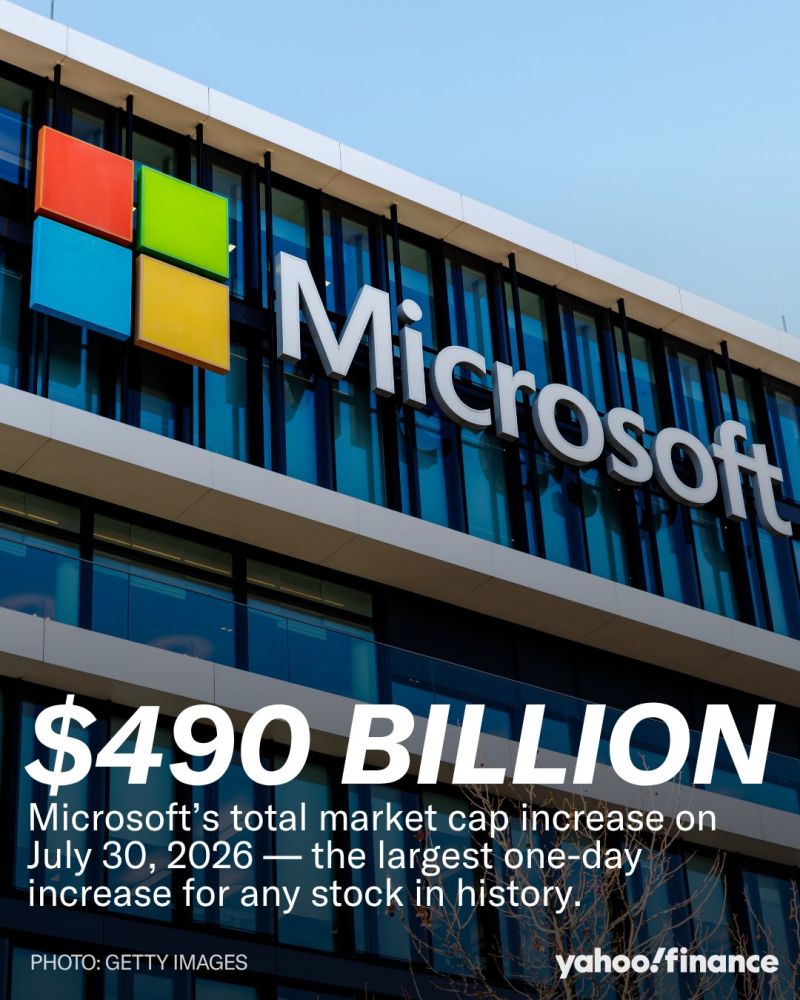
Yesterday, $MSFT just made history
The company just set a new record for the largest single-day-market-value increase in history. Source: Yahoo Finance
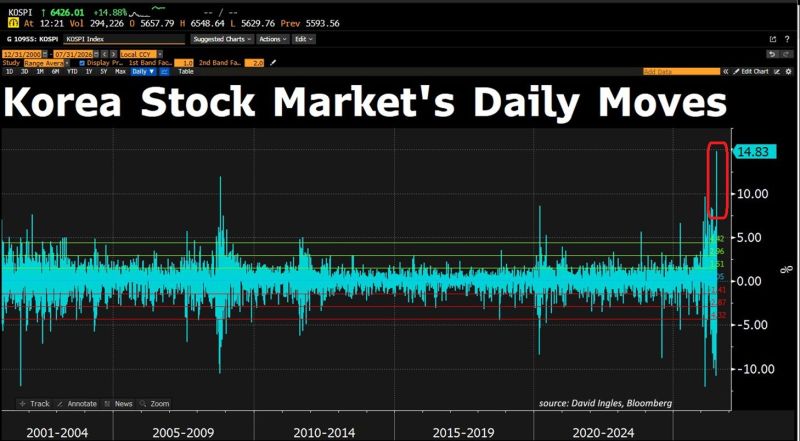
Korean stocks just staged one of the biggest rebounds in market history.
After a brutal 3-day, 17% selloff, the KOSPI soared as much as 18% on Friday, its largest single-day gain on record. The turnaround wasn't random. South Korea unveiled a major stabilization package, including ~$13.9 billion for strategic AI investments and tighter leverage rules for ETFs to reduce forced liquidations. At the same time, SK Hynix hit its 30% daily limit, helped by SK Group Chairman Chey Tae-won's first-ever open-market purchase of the company's shares, while Samsung surged as much as 27%. Investors also believe the worst of this week's deleveraging may now be over, while stronger AI spending outlooks from US Big Tech boosted confidence across semiconductor stocks. Adding to the shift, Japan and South Korea reportedly coordinated currency support, signaling policymakers are willing to act aggressively to stop an AI-driven selloff from becoming a broader financial crisis. Source: Bloomberg, Global Markets Investor
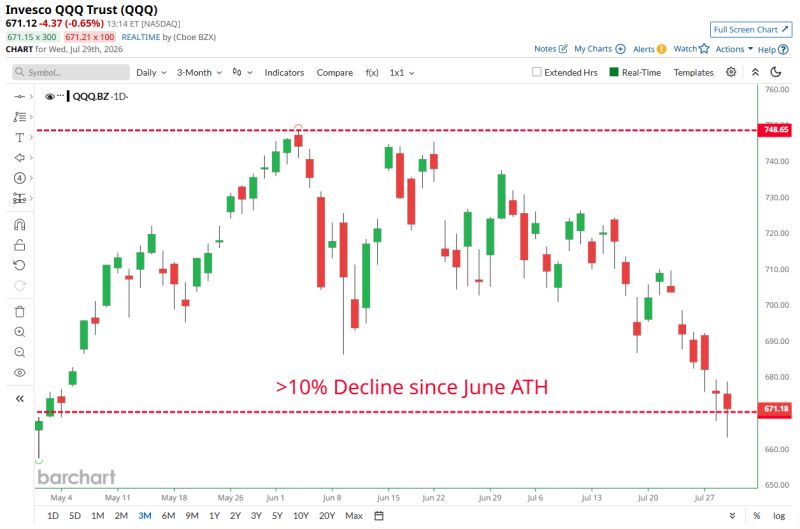
The Dow Jones Industrial Average closed 1,153.18 points lower, or 2.19%, for its worst decline since April 2025
Stocks tumbled for a myriad of reasons Wednesday, but mostly because the bond market signaled the Federal Reserve could be falling behind on the inflation fight as the central bank chose to keep interest rates unchanged. The S&P 500 slid 1.52%. The Nasdaq Composite fell 1.74% to 24,442.94, ending the session more than 10% off its all-time high. The Fed kept to the sidelines in its latest rate decision, and the bond market responded with the 10-year Treasury yield jumping 7 basis points to above 4.67%. The 30-year Treasury yield soared 10 basis points to above 5.2%, hitting its highest level since 2007. Three officials wanted a hike, but the Fed still stood pat on rates. And Fed Chairman Kevin Warsh’s tough talk failed to convince the bond market.
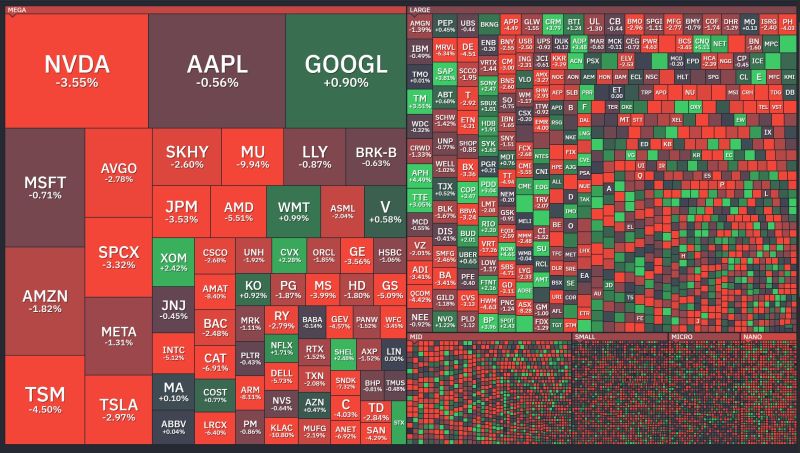
Nasdaq 100 $QQQ enters technical correction after dropping more than 10% from June's all-time high
Source: Barchart