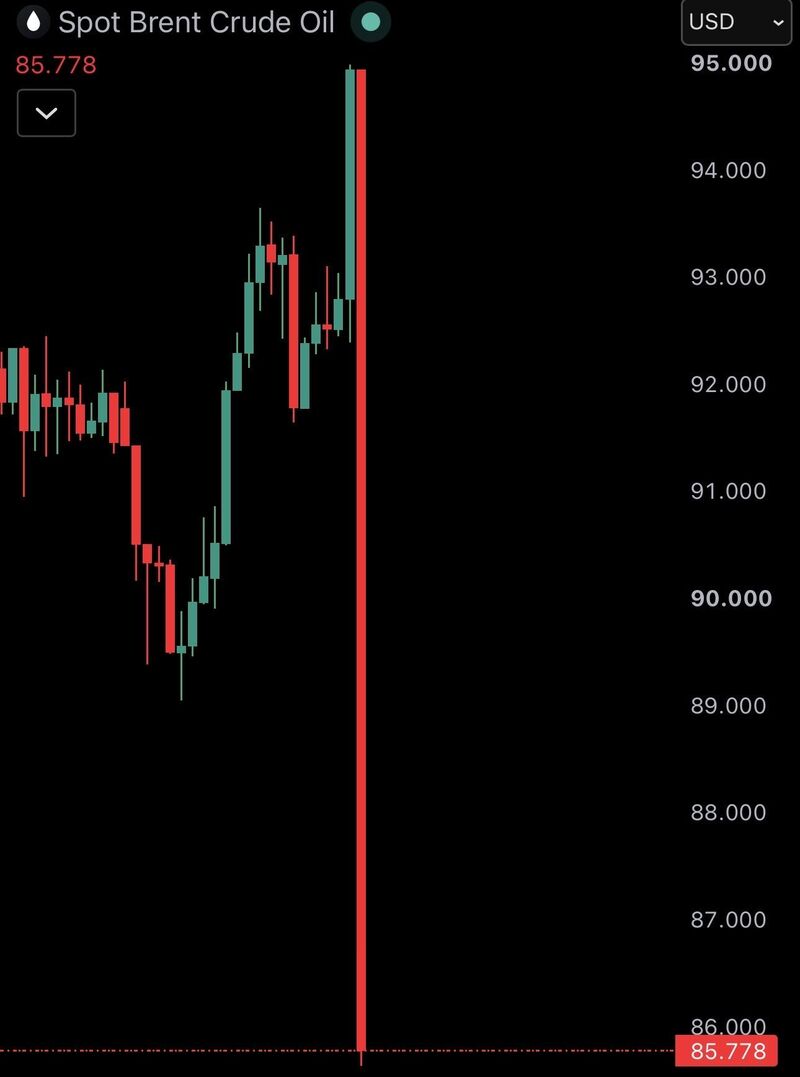
Brent Crude Oil crashes 10% as US and Iran halt strikes.
President Trump said the “perimeters of a deal” had been reached with Iran to reopen the Strait of Hormuz after speaking with Saudi Crown Prince Mohammed bin Salman (MbS). According to Saudi Arabia’s state news agency, both leaders emphasized dialogue, de-escalation, and pursuing a truce to prevent a wider regional conflict. Axios reported that MbS urged Trump to avoid large-scale strikes on Iran, warning of possible retaliation against Israeli and Gulf energy infrastructure. Saudi officials also sought clarity on U.S. military plans. As a key U.S. ally, Saudi Arabia has historically shaped Washington’s Iran policy and appears to have influenced efforts to delay or limit further escalation. Source: zerohedge
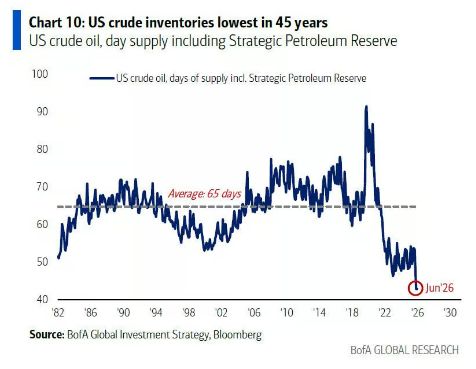
Crude Oil only has 43 days of supply left in the U.S., the lowest inventory in 45 years 🚨 🚨
Source: Barchart, BofA
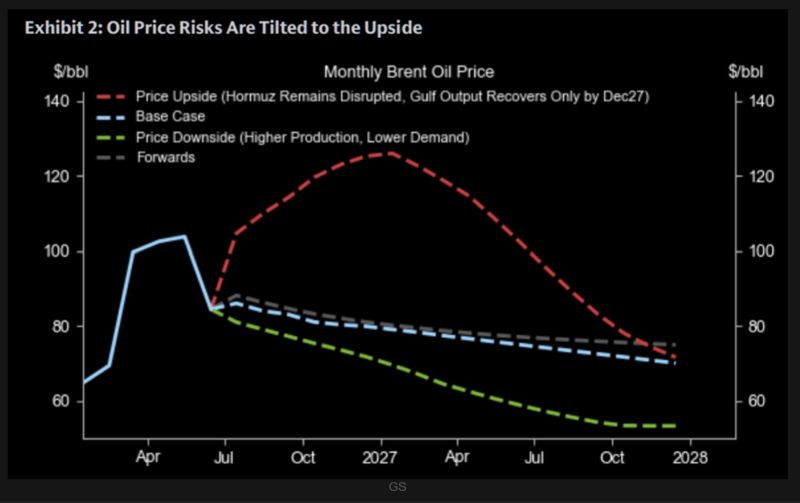
Goldman Sachs models a scenario where the Strait of Hormuz remains disrupted through late 2027.
Under these conditions, they project Brent crude could spike above $120/bbl by Q4 2026, before settling at an average of ~$100/bbl throughout 2027. This contrasts sharply with Goldman's $80 base case, suggesting current prices still assign relatively low odds to a prolonged physical supply disruption Source: GS, TME
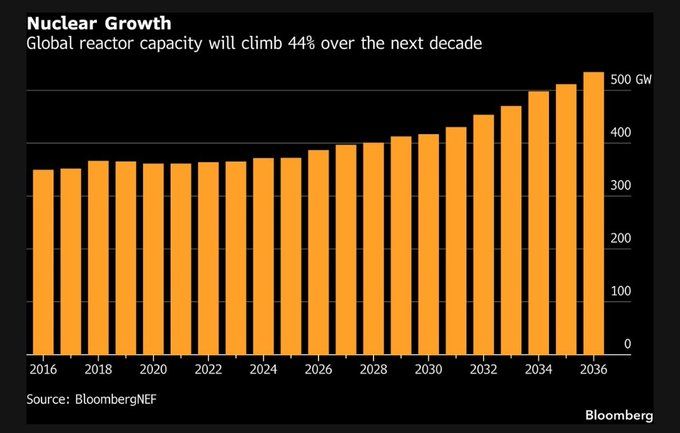
The uranium supply story is becoming impossible to ignore
Global nuclear reactor capacity is projected to grow 44% over the next decade. Every new 1 GW reactor requires: ~400 tonnes of uranium for its initial core load. ~160 tonnes per year thereafter to keep operating. Here's the catch: The first core loads alone for the reactors currently planned would consume uranium equivalent to nearly 90% of today's annual global mine production. That's before a single kilowatt-hour of electricity is produced. The market isn't just facing rising annual demand. It must first fill an enormous pipeline of initial fuel requirements. This is why many investors believe the structural bull case for uranium is still in its early stages. Source: Bloomberg, Lukas Ekwueme @ekwufinance
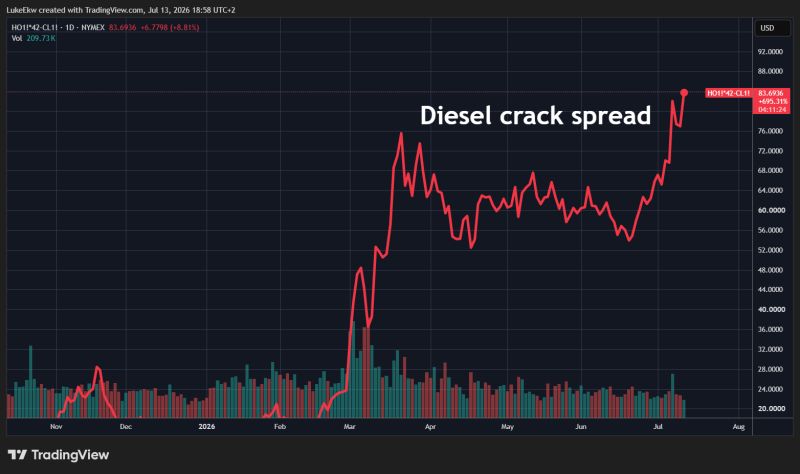
The diesel market is sending a warning that the oil market isn't.
Diesel crack spreads jumped another ~9% today, extending an already powerful rally. Why does it matter? Crude oil can be influenced by headlines, geopolitics and strategic reserves. Diesel reflects the real economy. It powers trucks, trains, ships, construction equipment and mining operations. When diesel crack spreads rise, refiners are signaling that distillate demand is outpacing supply. In other words, the market for one of the world's most important industrial fuels remains exceptionally tight. You can suppress the price of crude for a while. But it's much harder to hide what's happening in the fuel that keeps the global economy moving. Source: Lukas Ekwueme
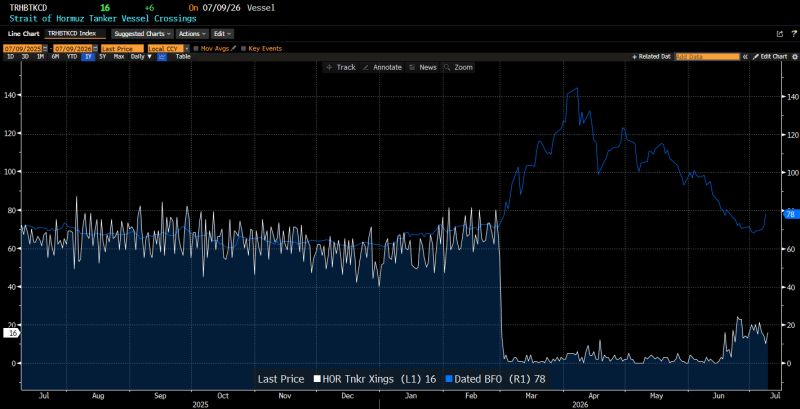
Strait of Hormuz 🇮🇷 oil crossings (in white) have not recovered, yet oil prices (in blue) are near the levels they were pre-war.
Source: Gordon Johnson
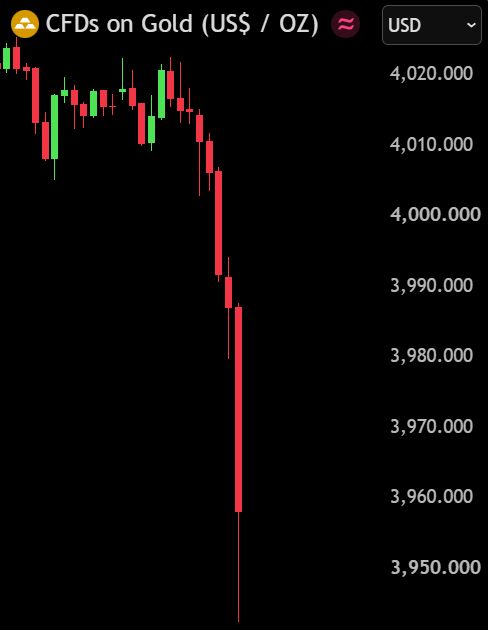
BREAKING: Gold is down -2% in the last 2 hours, falling below $3,950 and hitting a 34-week low.
Gold is now down -30% from its peak, wiping out over $12 trillion in market value. Source: Bull Theory @BullTheoryio
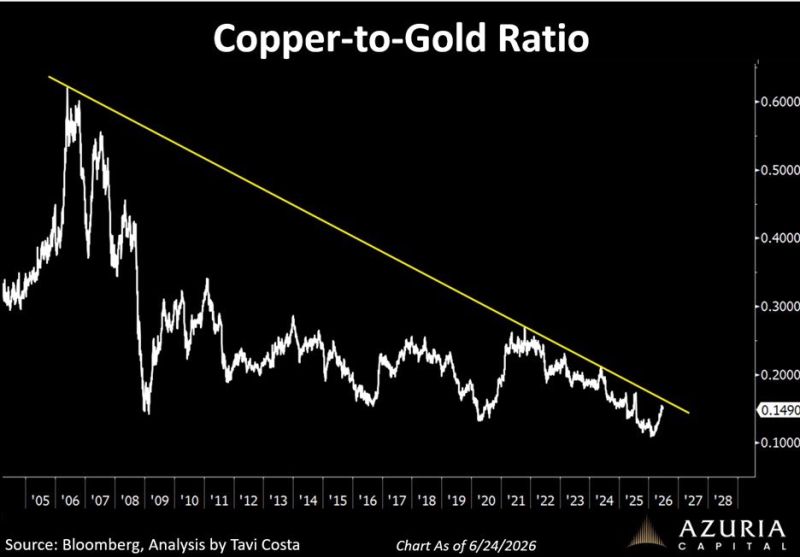
Could it be one of the most important breakouts developing in the entire commodity complex?
Source: Tavi Costa, Bloomberg