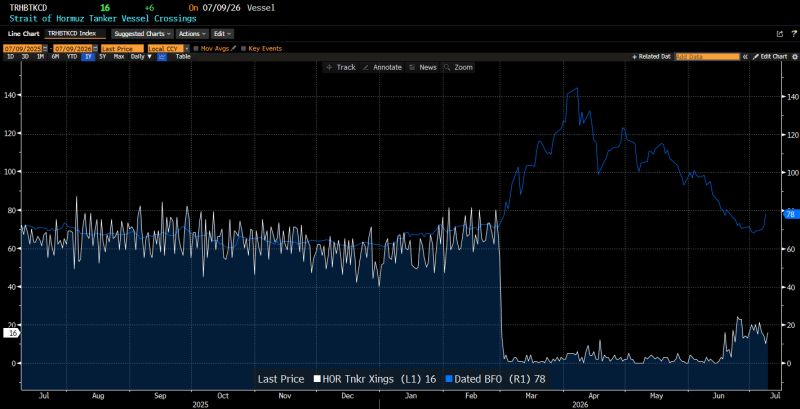
Strait of Hormuz 🇮🇷 oil crossings (in white) have not recovered, yet oil prices (in blue) are near the levels they were pre-war.
Source: Gordon Johnson
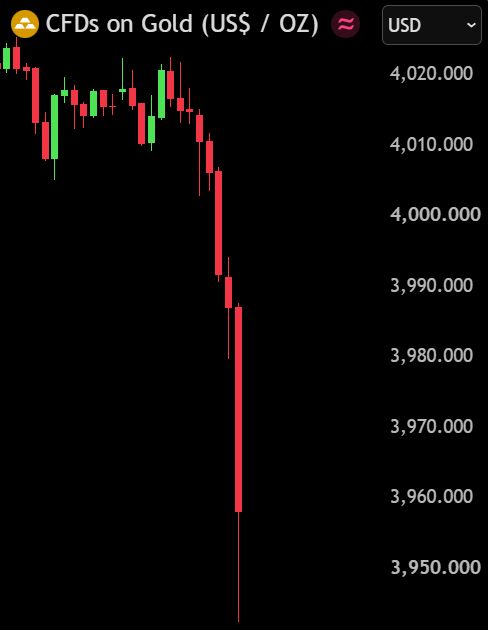
BREAKING: Gold is down -2% in the last 2 hours, falling below $3,950 and hitting a 34-week low.
Gold is now down -30% from its peak, wiping out over $12 trillion in market value. Source: Bull Theory @BullTheoryio
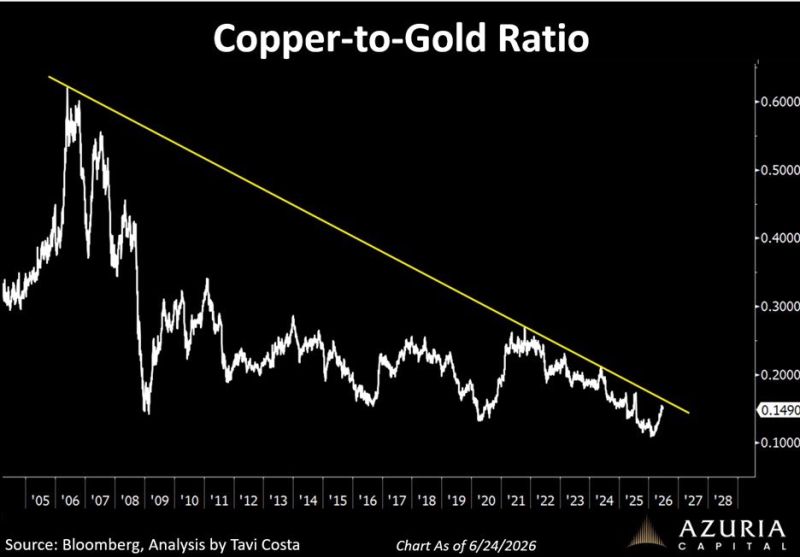
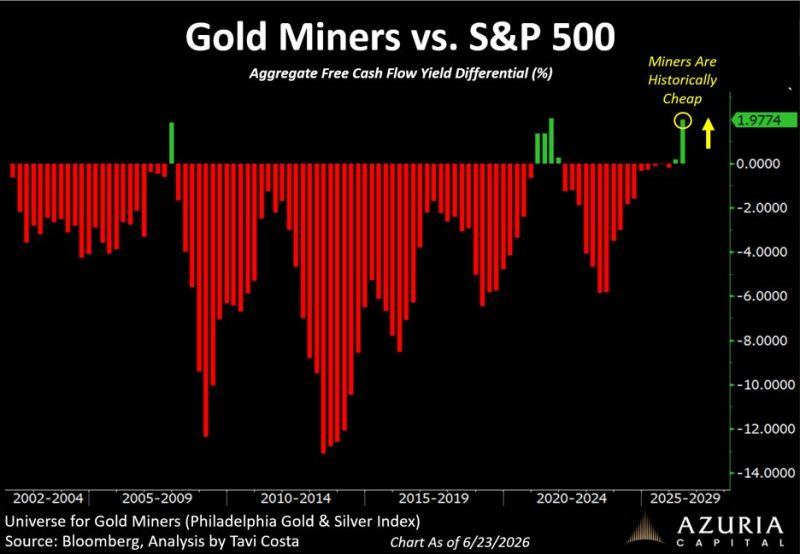
Could it be one of the most important breakouts developing in the entire commodity complex?
Source: Tavi Costa, Bloomberg
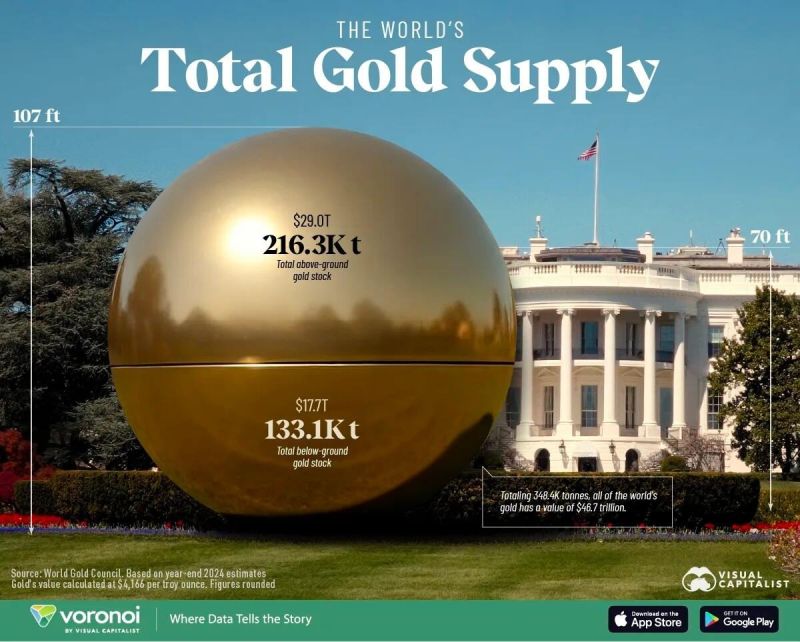
All the gold ever mined fits in a sphere 107 ft wide.
216,300 tonnes above ground. Worth around $29T That's it and that's the whole supply. It grows about 2% a year, and you can't print more. Source: Jack Prandelli on X, Visual Capitalist
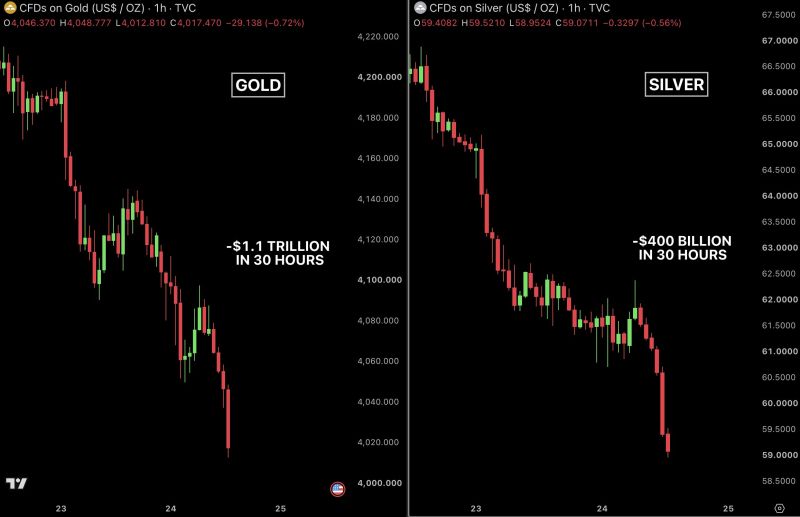
🚨Gold and silver are getting wrecked.
Last 30 hours: - Gold down -3.87%, wiping out $1.1 trillion. - Silver down -9.18%, wiping out ~$400 billion. Since the war started: - Gold down -25%, erasing $9.4 trillion. - Silver down -38%, erasing $2.7 trillion. From all time highs: - Gold down -28%, $11 trillion wiped. - Silver down -51%, $4.6 trillion wiped. Precious Metals were supposed to surge on war fear. Instead they crashed when the war started, and now they're crashing again as the war is ending. A buying opportunity ? Source: Bull Theory
Gold miners are trading at one of the deepest discounts to the S&P 500 on record.
Fundamentals remain strong. Prices keep falling. Source: Otavio (Tavi) Costa
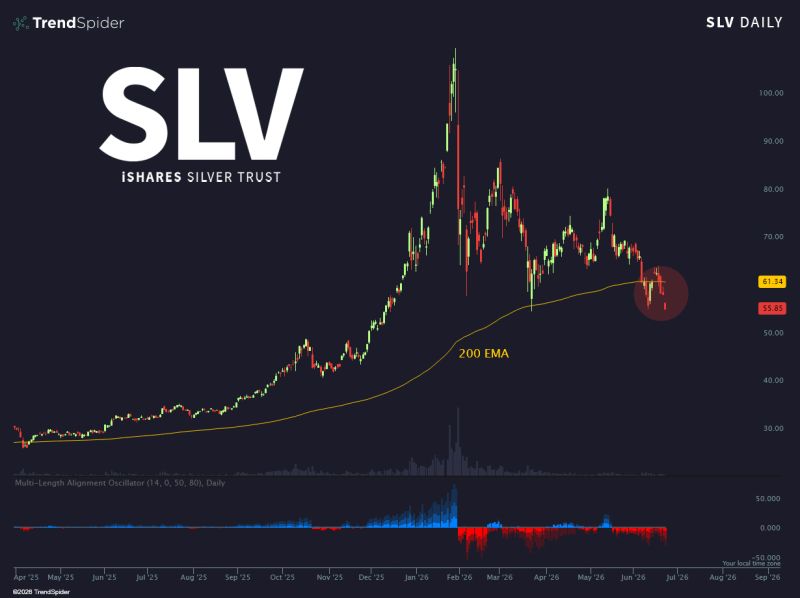
Ouch 🩸
Silver $SLV is in the midst of a 200EMA breakdown Source: Trend Spider
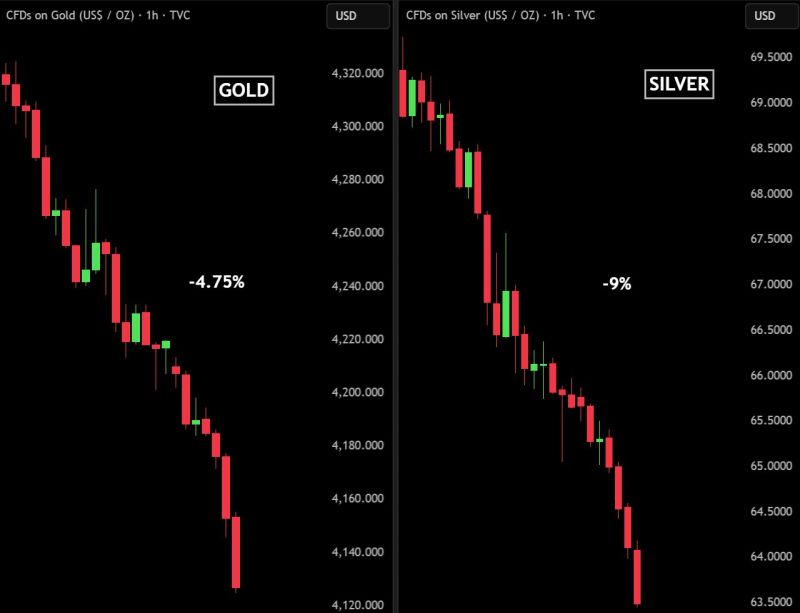
PRECIOUS METALS ARE CRASHING
Over $1.74 TRILLION has been wiped out from precious metals in the last 24 HOURS. Gold is down -4.75%, wiping out $1.41 trillion from its market cap. Silver is down -9%, wiping out $327 billion from its market cap. Source: Bull Theory