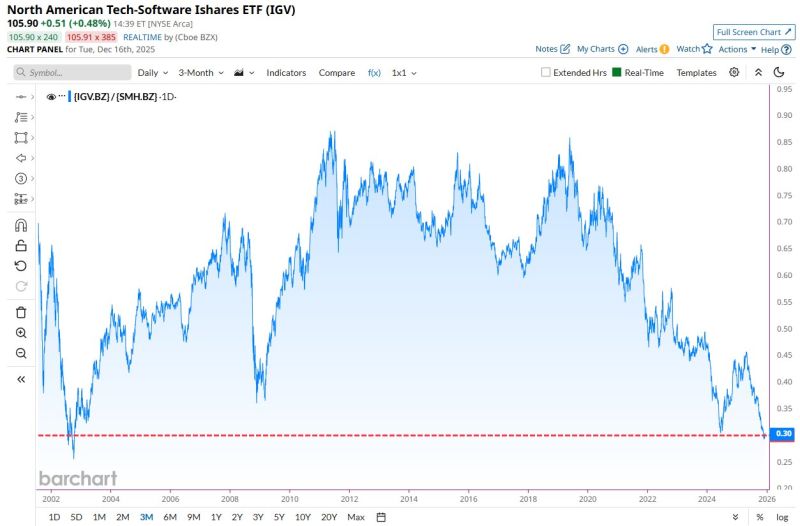
Software Stocks are now underperforming Semiconductors by the largest margin in more than 23 years
Source: Barchart
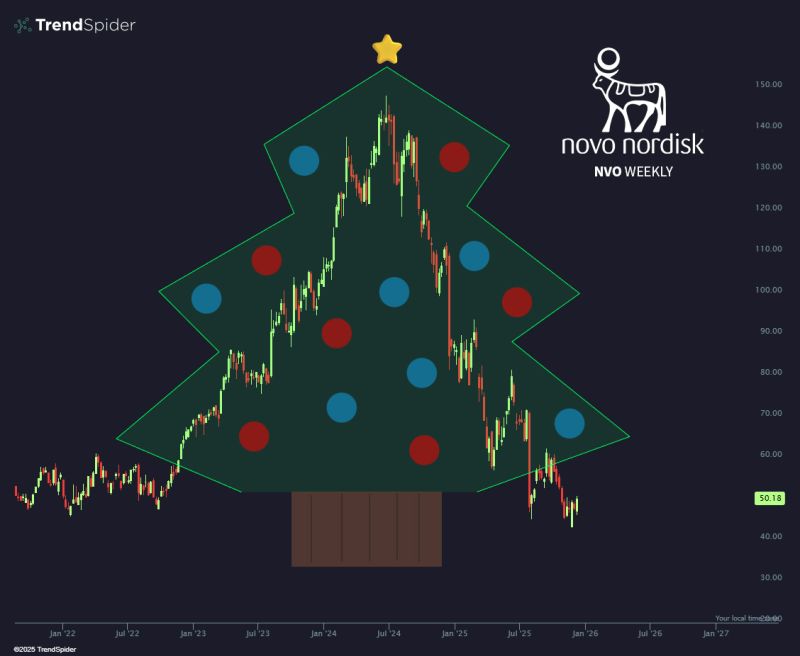
Technical analysis reinvented with Novo Nordisk $NVO Christmas Tree
It's the most wonderful time of the year 🎶 Source: Trend Spider
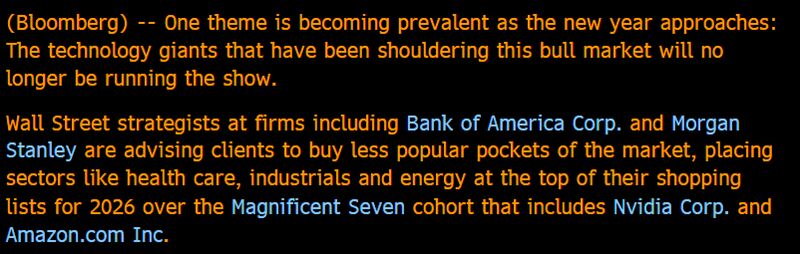
As rightly said by Eric Balchunas many strategists are calling for rotation out of Mag 7 next year..
But let's be honest they said same thing this year and Mag 7 beat market YTD and crushed it since Liberation Day. Will 2026 be different? Source: Bloomberg
In case you missed it...Tech may finish the year with a lower Forward P/E than it began the year...
Tech bubble? Are you sure? Source: Seth Golden @SethCL Factset
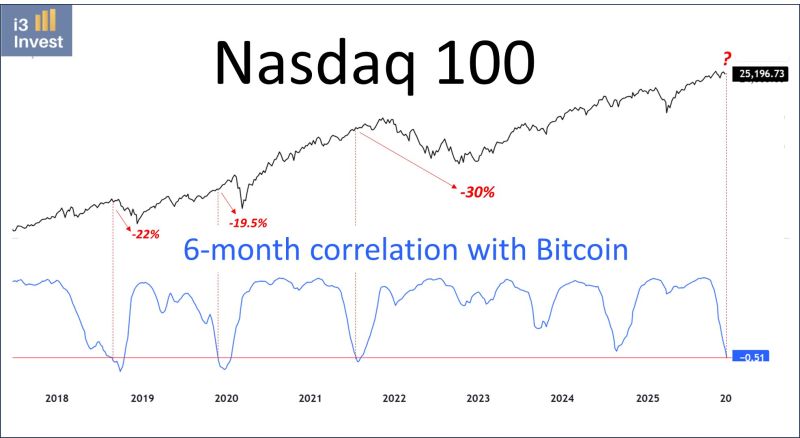
Interesting chart by Guilherme Tavares i3 invest ➡️ when the correlation between BTC and the Nasdaq 100 gets too low (below -0.5), the Nasdaq 100 usually experiences a much deeper drawdown.
It is not necessarily a timing indicator or a “sell everything” signal. But it shows that BTC is more sensitive to liquidity and tends to lead.
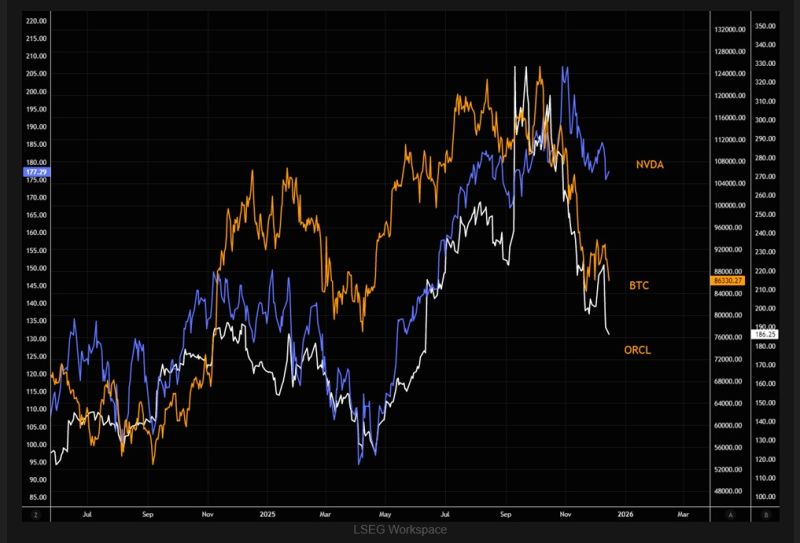
Same same? Are we just seeing "psychology on steroids" being washed out?
All these ex hot assets have moved in close tandem for a long time. Chart below shows Bitcoin $BTC, Nvidia $NVDA and Orcale $ORCL. Source: LSEG, The Market Ear
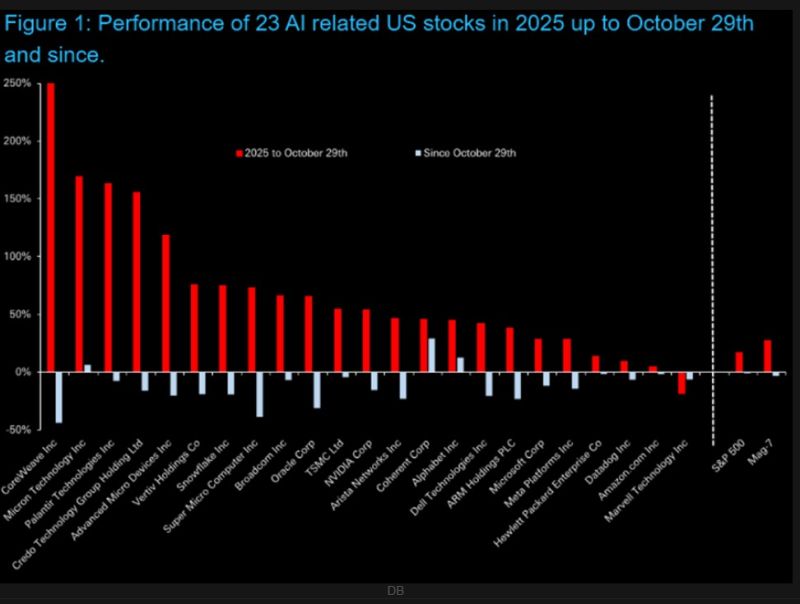
DB's chart of the day tracks 23 AI-related stocks, comparing year-to-date performance up to 29 October with returns over the roughly six weeks since.
Before 29 October, just one stock was down on the year and the group had posted an average unweighted gain of +70%; since then, the picture has shifted sharply, with 20 of the 23 now trading lower. Source: DB, The Market Ear
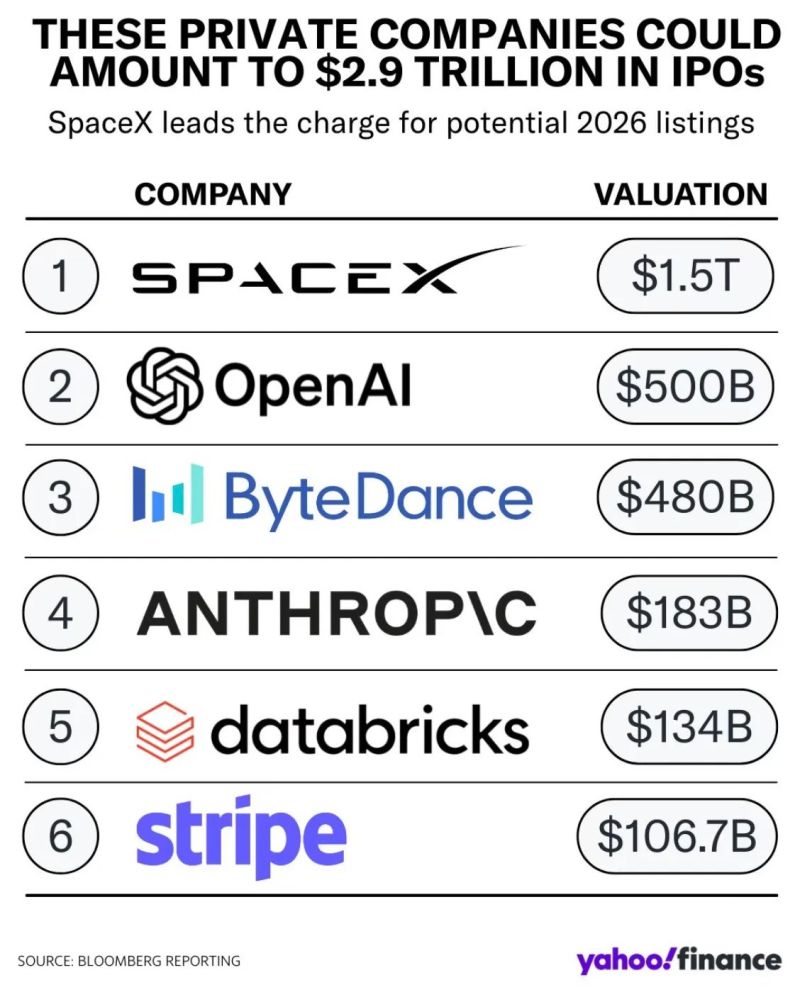
2026 is expected to be the year of BIG IPOs.
See below a nice chart from @YahooFinance on some huge IPOs expected next year. Source: Ryan Detrick