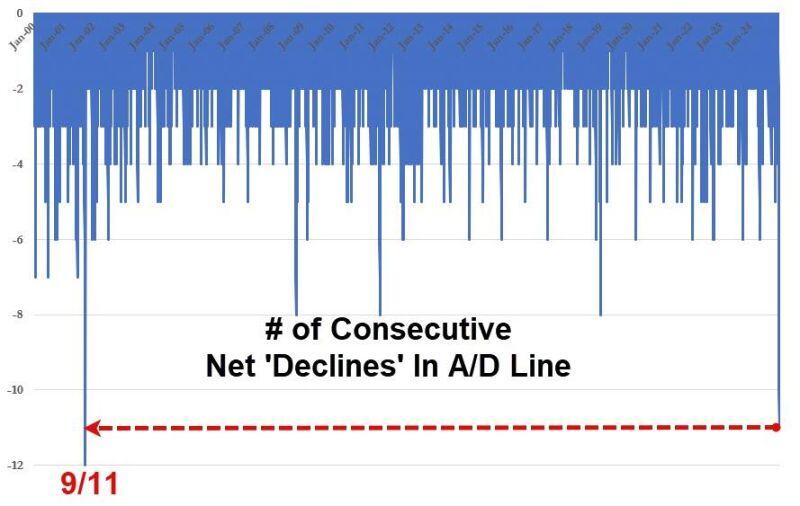
This is crazy: 11 consecutive days of more decliners than advancers in the S&P500.
First time since Sept 11, 2001 Source: zerohedge
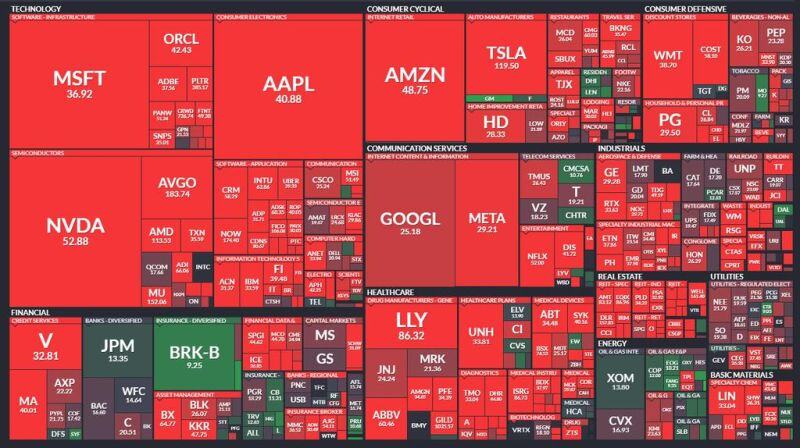
🚨 The S&P 500 P/E Ratios Heat Map.
What do you notice? $SPY Source: Jesse Cohen @JesseCohenInv
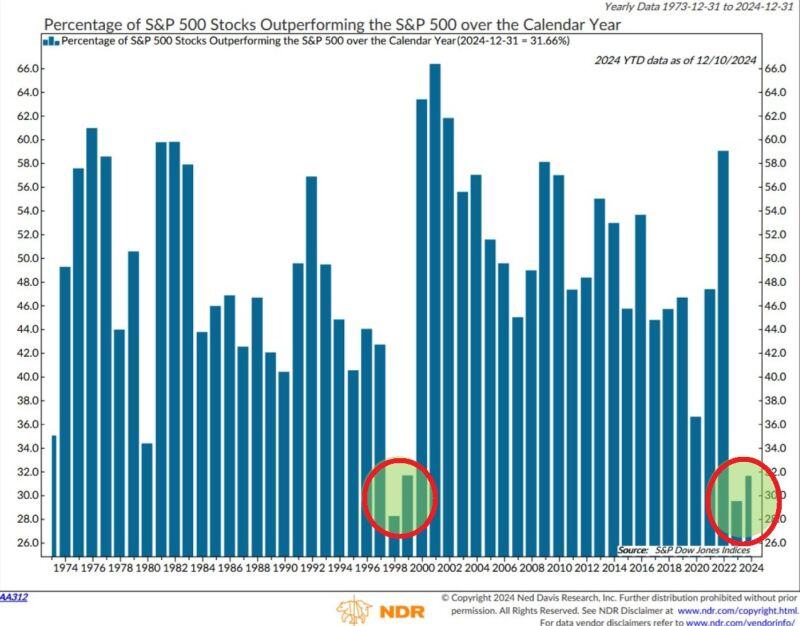
🚨Only 32% of the S&P 500 firms have outperformed the index year-to-date after 29% in 2023, one of the lowest readings on record.
In other words, 32% of companies gained more than 27% this year. In the past, this happened only once, in the 1998-1999 Dot-Com Bubble. Source: Global Markets Investor
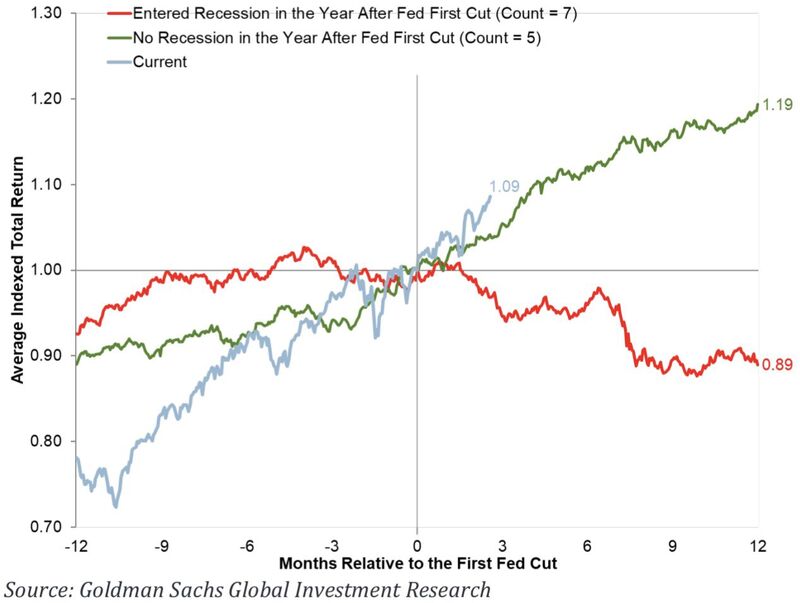
The path of the $SPX S&P500 after the 1st Fed cut is determined by whether the economy ends up in recession or not.
This time around, the $SPX has been closely mirroring the Soft Landing Source: Goldman Sachs, David Marlin
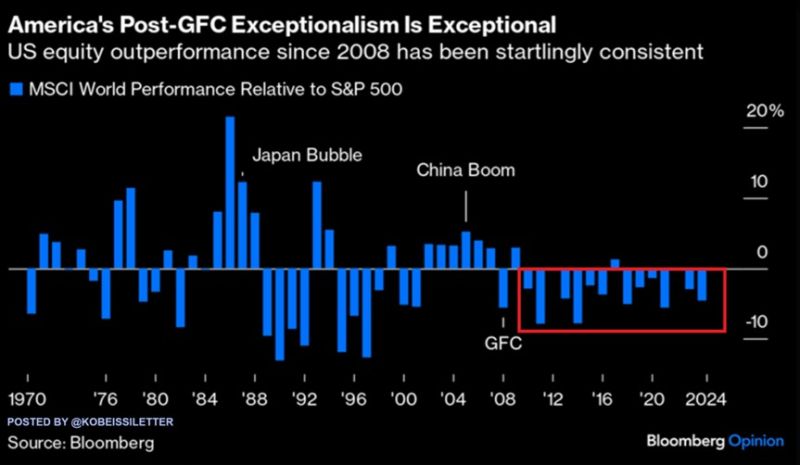
The US stock market is making history:
The SP500 is now on track to outperform global stocks for the 14th year out of the last 15. This is the longest streak in at least 75 years. During this period, the index has rallied 446%, almost DOUBLE the 229% gain of the MSCI World index. This year alone, the S&P 500 has risen 28%, beating global stocks by 6 percentage points. As a result, the US stock market now reflects a record 74% of the MSCI World Index, even surpassing the 1970s. Source: Bloomberg Opinion, The Kobeissi Letter
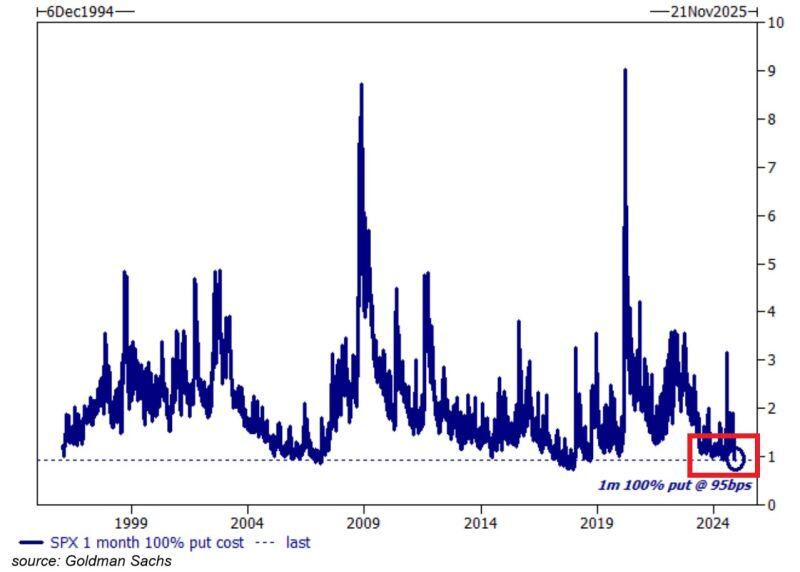
⚠️MONDAY MARKET WARNING:
There were only 2 times in history when the cost of hedging for a month against S&P 500 drop was lower than now. This means these put options will profit if the SP500 falls by at least 50 points at any time over the next month. Source: Global Markets Investor
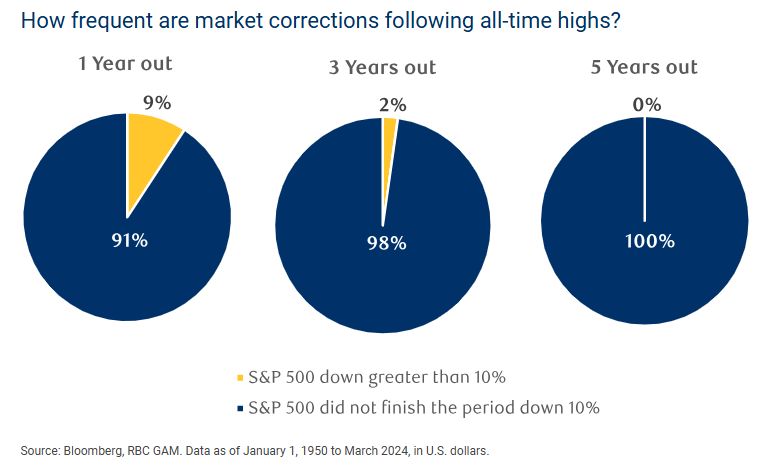
How frequent are market corrections following all-time highs?
Source: Mike Zaccardi, CFA, CMT, MBA
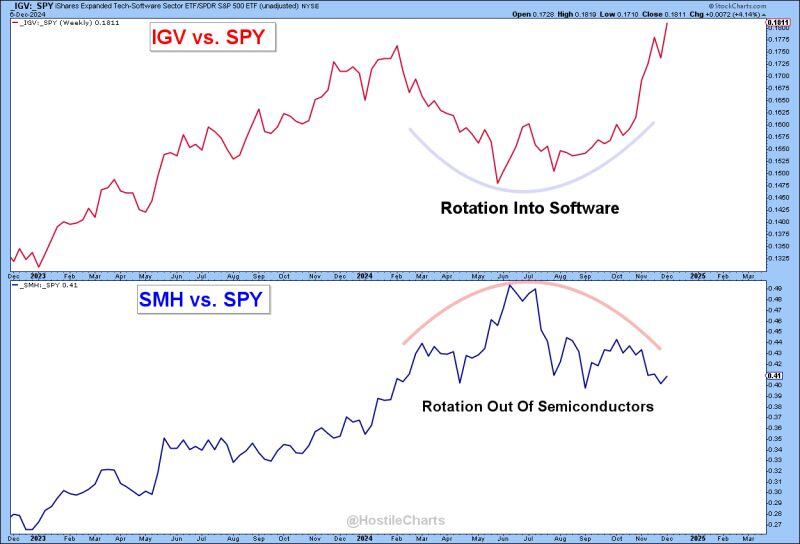
"Rotation is the Lifeblood of a Bull Market"
As Semis $SMH cooled off, they handed the baton to Software $IGV. The result? $XLK closed at new ATHs this week. Software & Semis now carry roughly equal weight in the S&P 500 $SPY. Source: Larry Thompson, CMT CPA @HostileCharts