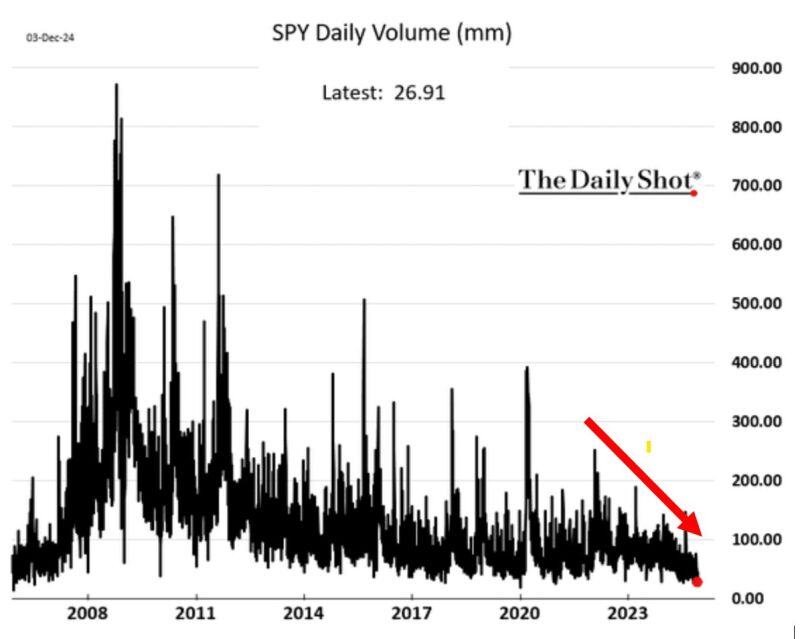
US STOCK MARKET LIQUIDITY IS FALLING
S&P 500 ETF daily trading volume PLUNGED to 26.9 million on Tuesday, near the lowest since 2007. At the same time, S&P 500 futures trading volume FELL to the lowest in 3 YEARS. This increases the risk of some wild moves going forward. Source: Global Markets Investor, The Daily Shot
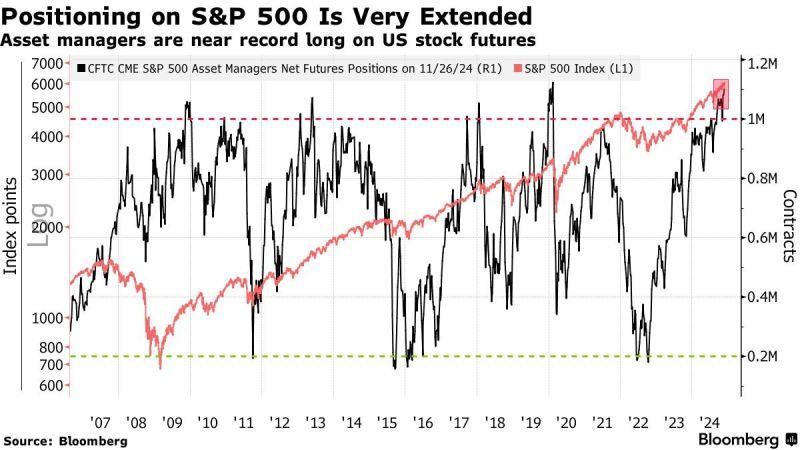
S&P 500 futures positioning is very extended. Nearing record long levels, according to Citi.
Source: Barchart, Bloomberg
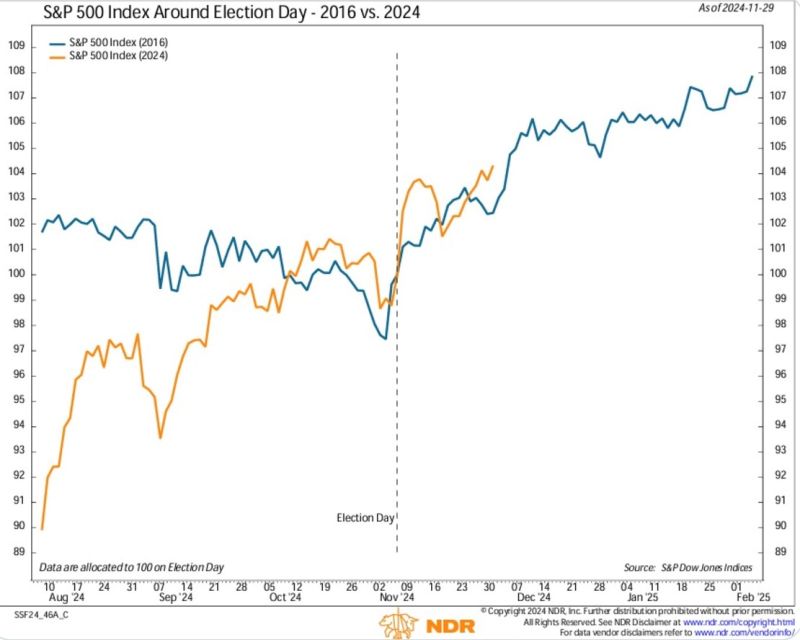
Interesting analog regarding Trump 1.0 vs Trump 2.0 from NDR.
S&P 500 rallied after both elections.
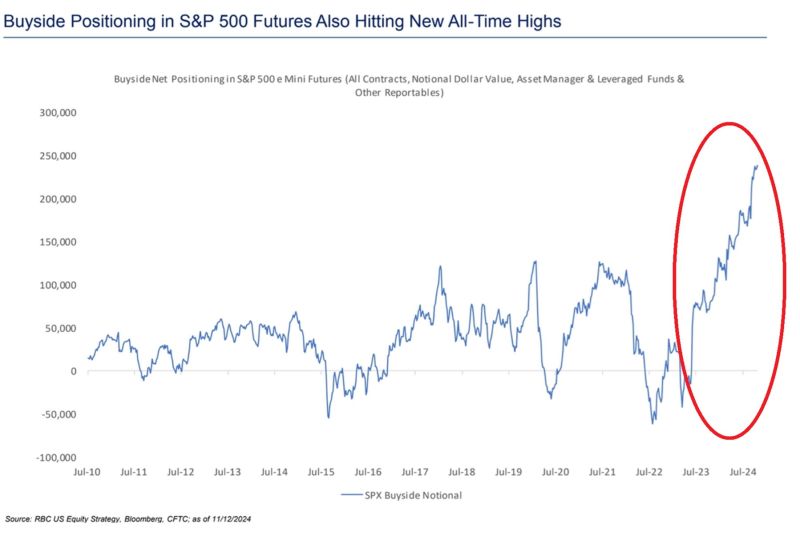
🚨INSTITUTIONAL INVESTORS HAVE NEVER BEEN MORE BULLISH🚨
Asset managers, leveraged funds and other investors net LONG positioning in the S&P 500 exceeded 240,000 contracts, the most on record. This is DOUBLE the amount seen in 2021 before the bear market started. Euphoria is an understatement. Source: Global Markets Investor
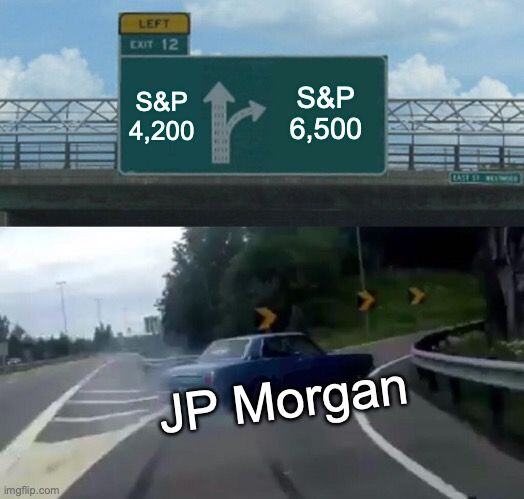
Wow! JPMorgan's S&P 500 target for the end of 2024 was 4,200. For 2025, it's now 6,500
Source: Trend Spider
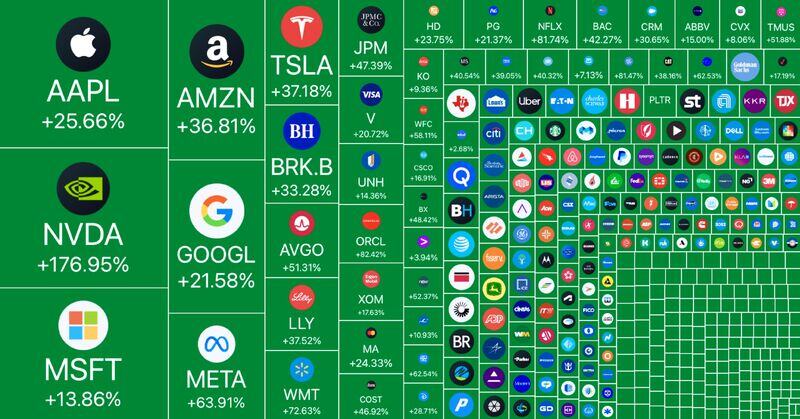
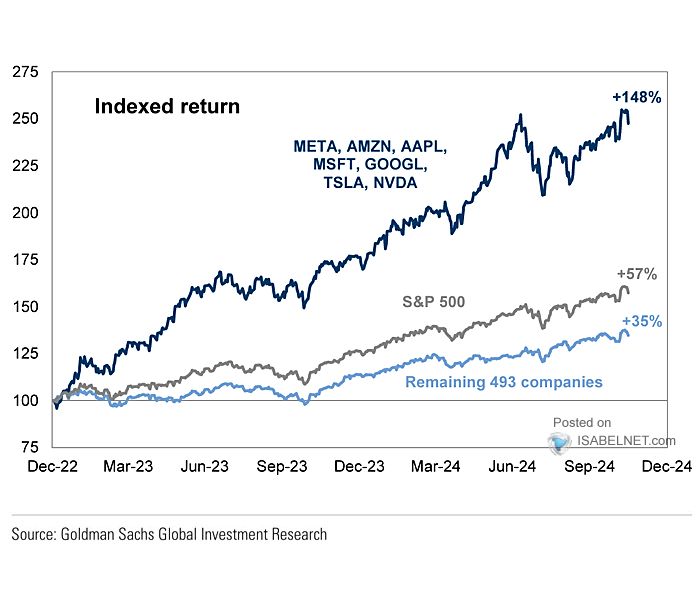
With their massive market caps and impressive price appreciation, the Magnificent7 stocks have played a crucial role in driving the S&P 500 index’s performance.
Without them, S&P 500 returns since December 2022 would be much closer to average, still good, mind you, but more average. 🤣 @ISABELNET_SA thru Lance Roberts on X
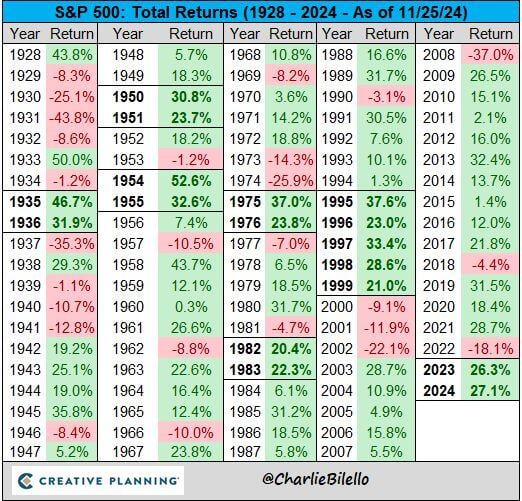
The S&P 500 is currently on pace for back-to-back years with a total return above 20%.
The last time that happened: 1998-1999. $SPX Source: Charlie Bilello
The S&P 500 has gained over $10 trillion in value this year.
Source: Brew Markets