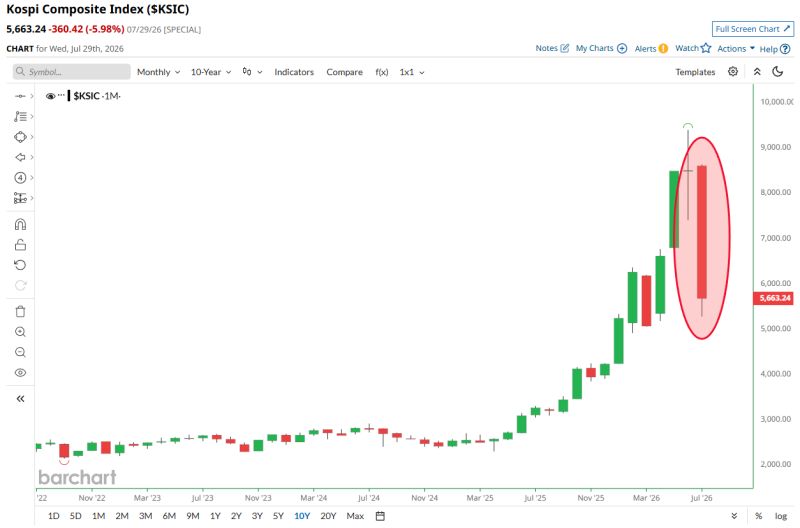
South Korea's Stock Market has plunged more than 33% this month
It is on track for its worst month in history, surpassing the October 1997 IMF Crisis (-27%) and the October 2008 Global Financial Crisis (-23%) 📉 📉 Source: Barchart
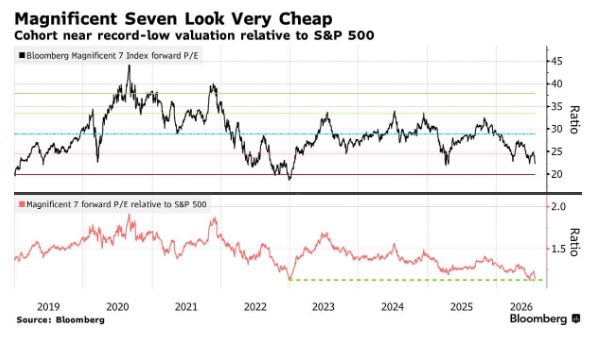
Mag 7 stocks are now trading near their cheapest valuation in history relative to the S&P 500
Source: Barchart, Bloomberg
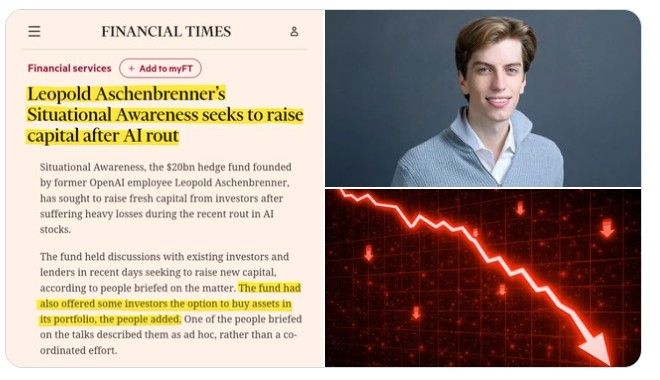
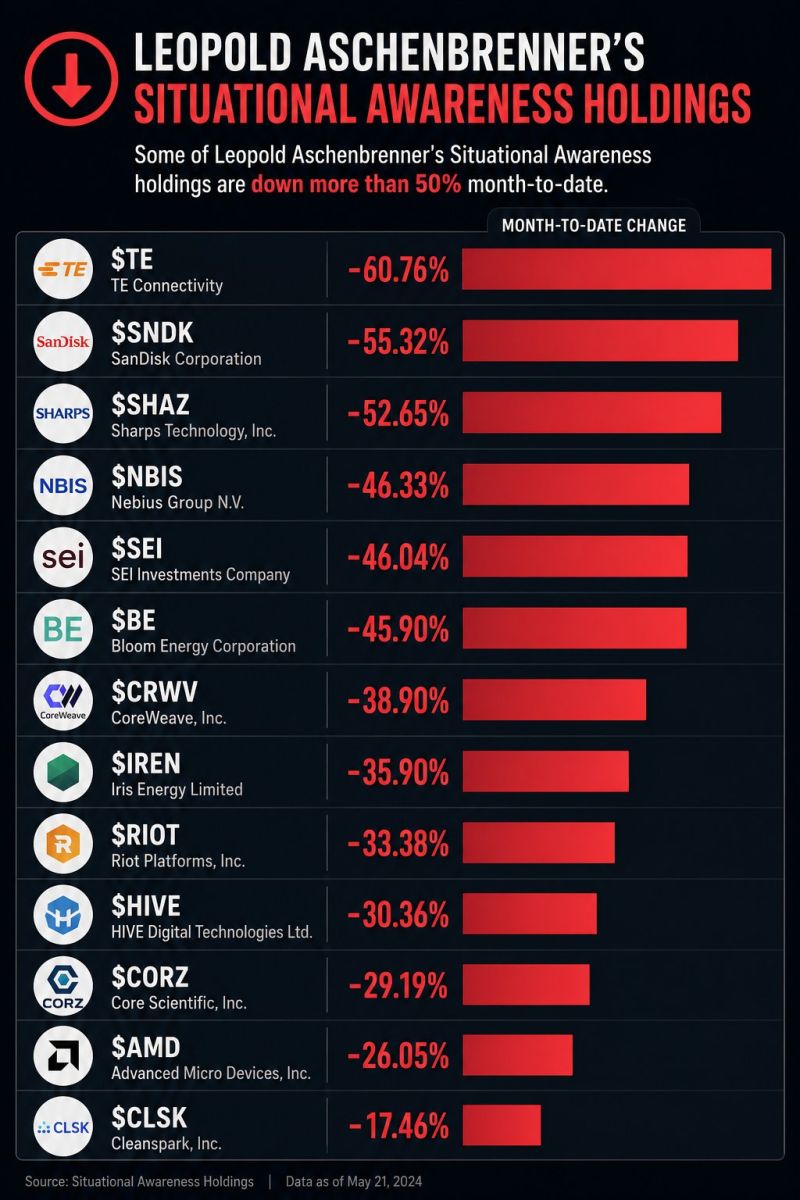
Star AI investor Leopold Aschenbrenner is unwinding trades after steep losses
Leopold Aschenbrenner's $20 billion AI hedge fund may be facing its first real stress test. After leaving OpenAI, Aschenbrenner became one of the most influential voices in AI with his viral Situational Awareness essay predicting AGI by 2027. He launched Situational Awareness LP in late 2024 with $225 million. Within two years, assets reportedly surged to ~$20 billion, fueled by massive gains in AI stocks. Now the trade is reversing. Oracle and AMD have each fallen around 20% in July, while smaller AI names such as Nebius, Bloom Energy, and SanDisk have dropped even more. The biggest signal? The fund is reportedly offering some investors the opportunity to purchase assets directly from its portfolio. That's unusual. Rather than selling into a weak market and pushing prices even lower, it may be seeking liquidity through private transfers. When even the hottest AI funds start looking for liquidity, investors should pay attention. Source: FT, Bull Theory
Here's a great post on Situation Awareness Hedgefund by CoinPost Inc.
Leopold Aschenbrenner's $20B Situational Awareness fund was up +439% through June... then July erased a huge chunk of those gains as leveraged AI bets unraveled. Instead of de-risking, he's raising fresh capital and calling this "the best buying opportunity since early 2025." His main recovery catalyst? A potential Anthropic IPO. Sometimes the biggest conviction trades look the worst right before they recover. $TE -60.76% $SNDK -55.32% $SHAZ -52.65% $NBIS -46.33% $SEI -46.04% $BE -45.90% $CRWV -38.90% $IREN -35.90% $RIOT -33.38% $HIVE -30.36% $CORZ -29.19% $AMD -26.05% $CLSK -17.46% In a letter to LPs he called the pullback one of the best buying opportunities since early 2025 and opened a new funding window for Aug 1. Anthropic IPO cited as a possible H2 catalyst. Even the biggest AI bulls aren’t immune... Source: Coinpost
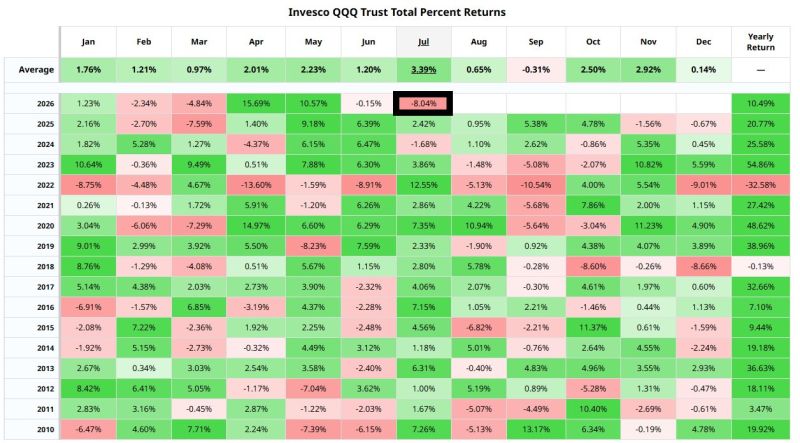
Nasdaq 100 $QQQ is now on track for its worst July in 24 years
Source: Barchart
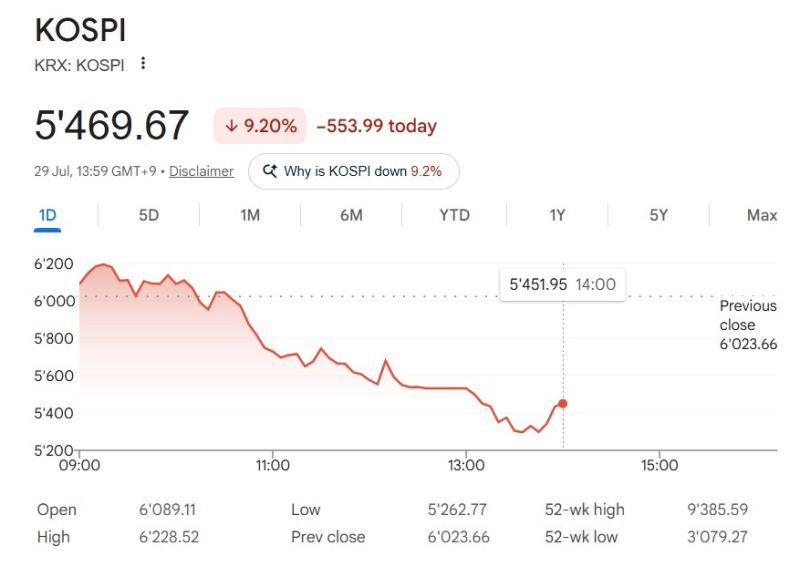
South Korea's stock market is in free fall.
Korea Exchange halted all stock and program trading for the second consecutive day after the KOSPI crashed -8%. KOSPI triggered its ninth circuit breaker of the year and is down -18% in just two days. South Korea has fallen from the world's 6th-largest stock market to 11th after the crash. Source: Bull Theory
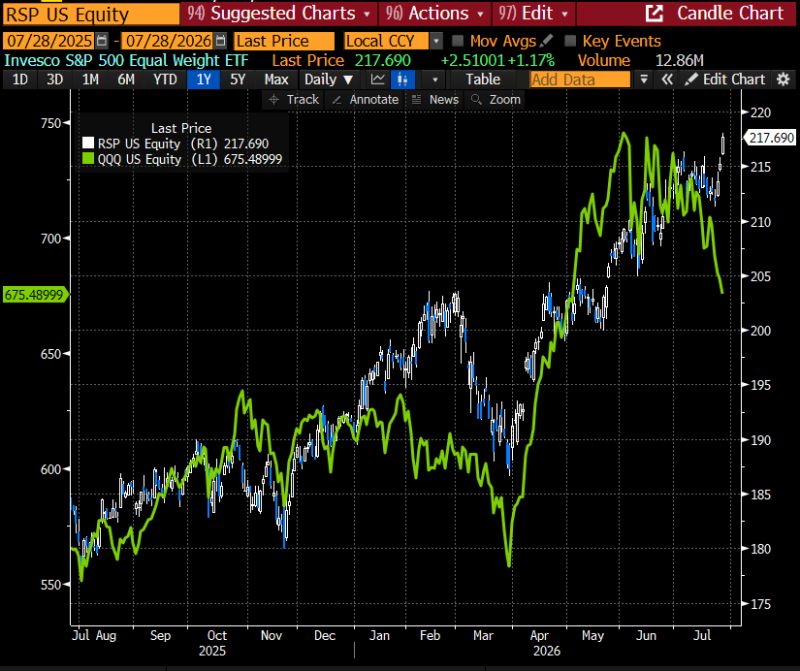
This is what a rotational market looks like
S&P 500 Equal weight (white bars) juste made a new all-time high Nasdaq (in green) is getting hammered Source: Bloomberg, RBC
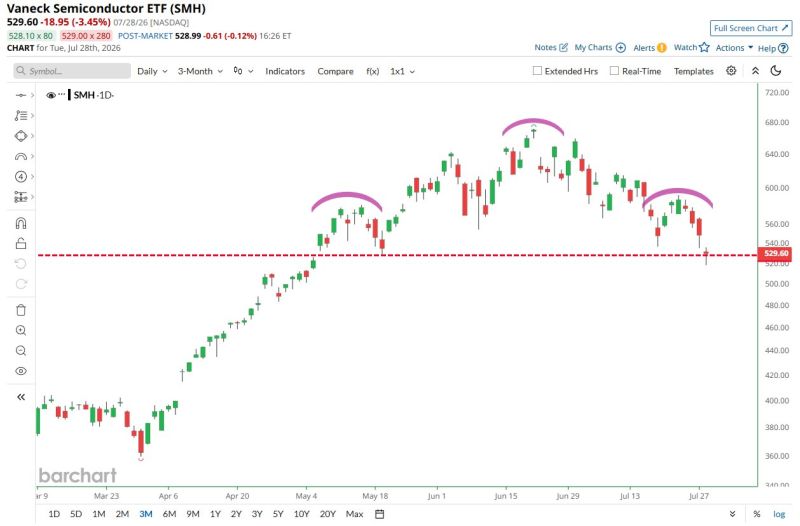
Semiconductor Stocks Head & Shoulders Pattern almost completely formed now It's sitting right on the neckline, if it breaks 528, look out
Source: Barchart