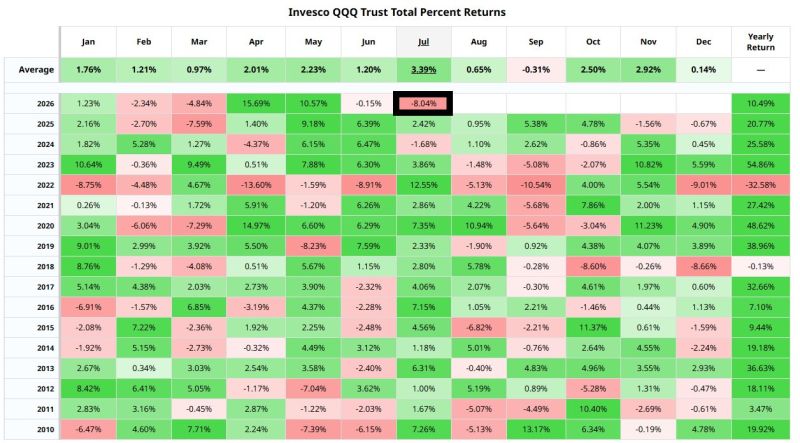
Nasdaq 100 $QQQ is now on track for its worst July in 24 years
Source: Barchart
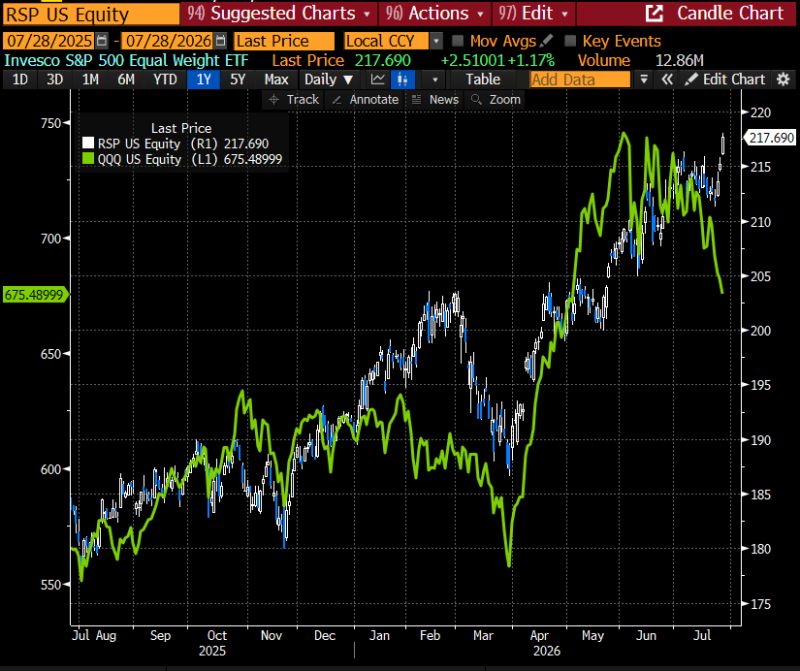
This is what a rotational market looks like
S&P 500 Equal weight (white bars) juste made a new all-time high Nasdaq (in green) is getting hammered Source: Bloomberg, RBC
Semiconductor Stocks Head & Shoulders Pattern almost completely formed now It's sitting right on the neckline, if it breaks 528, look out
Source: Barchart
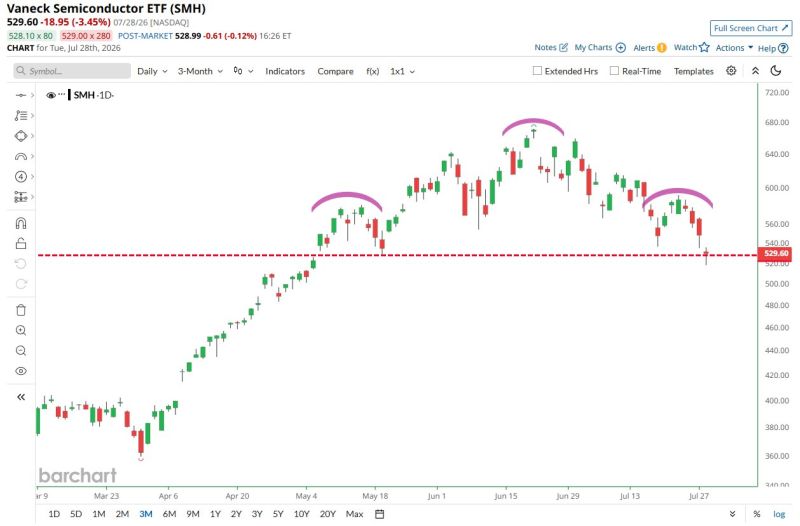
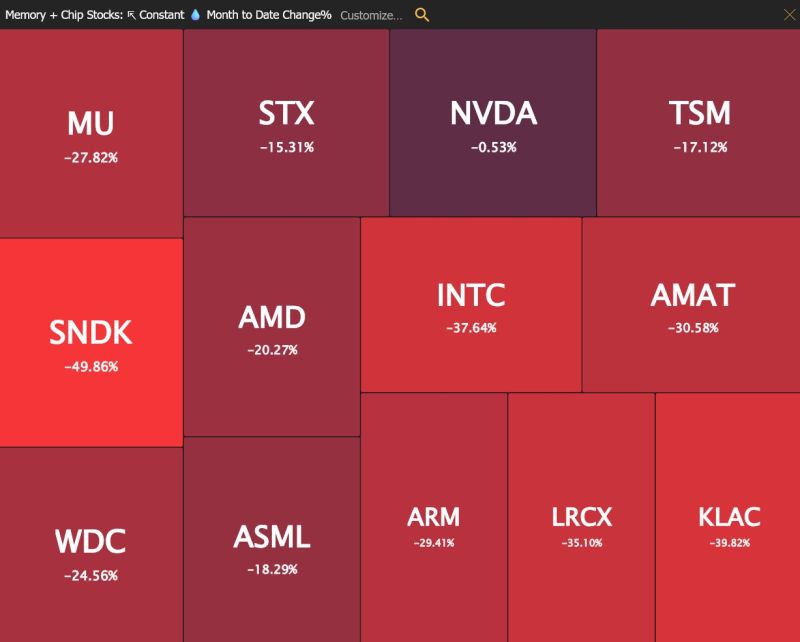
July has been nothing but brutal to chip and memory stocks
Source: TrendSpider
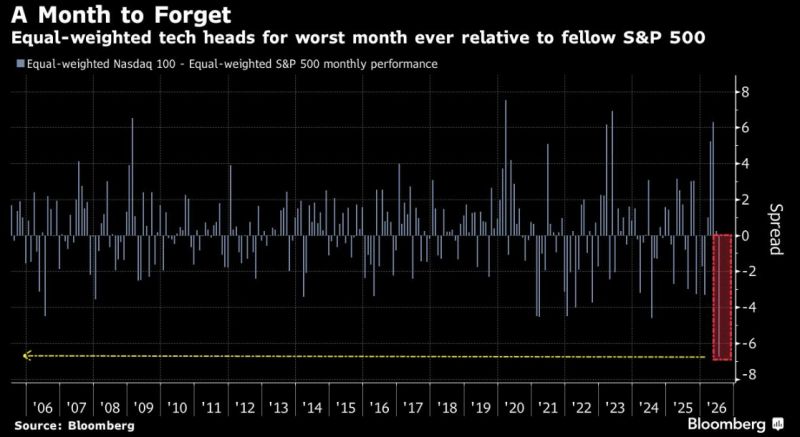
Nasdaq 100 Equal-Weight eyes historic divergence. Equal-weighted tech heads for worst month ever relative to S&P 500 Equal-Weight.
Source: HolgerZ, Bloomberg
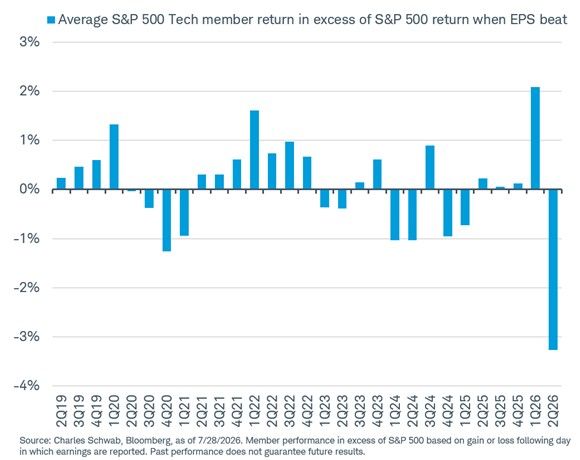
Per Charles Schwab: Weird times for the Tech sector.
On average (so far) this earnings season, a Tech stock that beats EPS estimates is underperforming the S&P 500 by 3.3% the day of/after reporting. Source: Charles Schwab, RBC
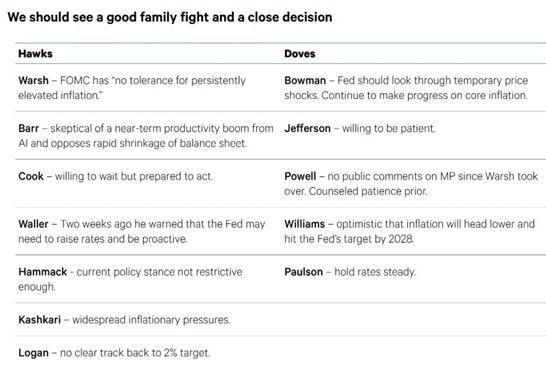
NDR's latest assessment suggests the market may be underestimating the risk of a near-term Fed rate hike.
Their view is that several Fed governors remain concerned about inflation and are reluctant to ease policy too soon, fearing it could undermine the Fed's inflation-fighting credibility. In other words, preserving credibility may take priority over delivering the rate cuts markets are expecting. Source: NDR
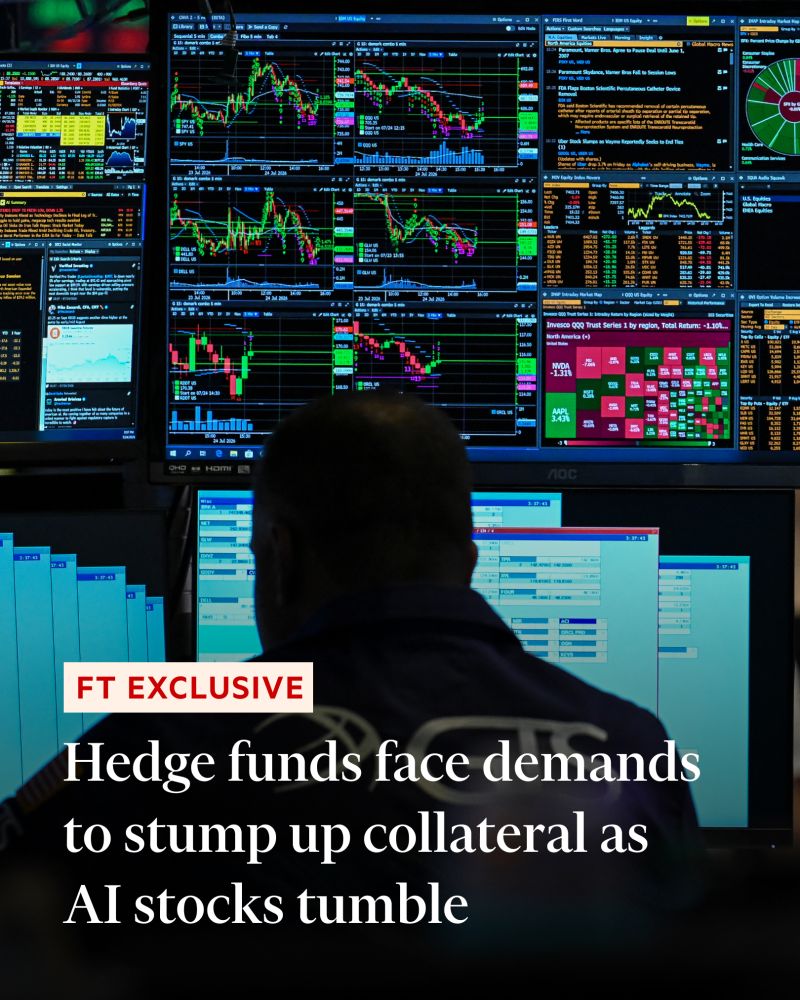
Hedge funds face demands to stump up collateral as AI stocks tumble
FT Exclusive: Wall Street banks have asked funds heavily concentrated in certain industries to provide additional collateral, highlighting the mounting fears about the scale of losses across several popular strategies Wall Street banks have demanded more collateral from hedge funds in recent weeks as a rout in AI stocks accelerates and triggers heavy losses across several popular strategies. Banks asked funds whose holdings are heavily concentrated in certain industries to provide additional collateral to keep their existing levels of leverage, according to four people familiar with the matter. The collateral demands highlight the mounting fears on Wall Street about the scale and speed of the sell-off in AI stocks over the past fortnight, which has upended a rally in a sector favoured by many funds. Source: Financial Times