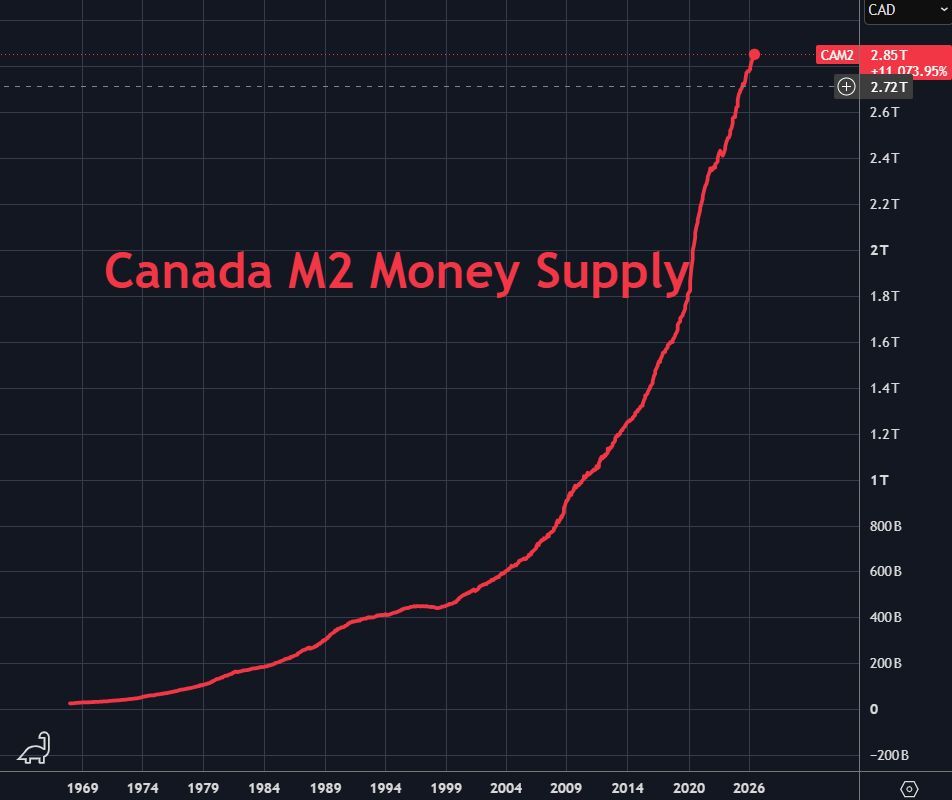
No developed economy is printing as much as Canada is
Canada doubles its monetary base roughly every 8 years. Will other developed nations play catch-up soon? Source: Lukas Ekwueme
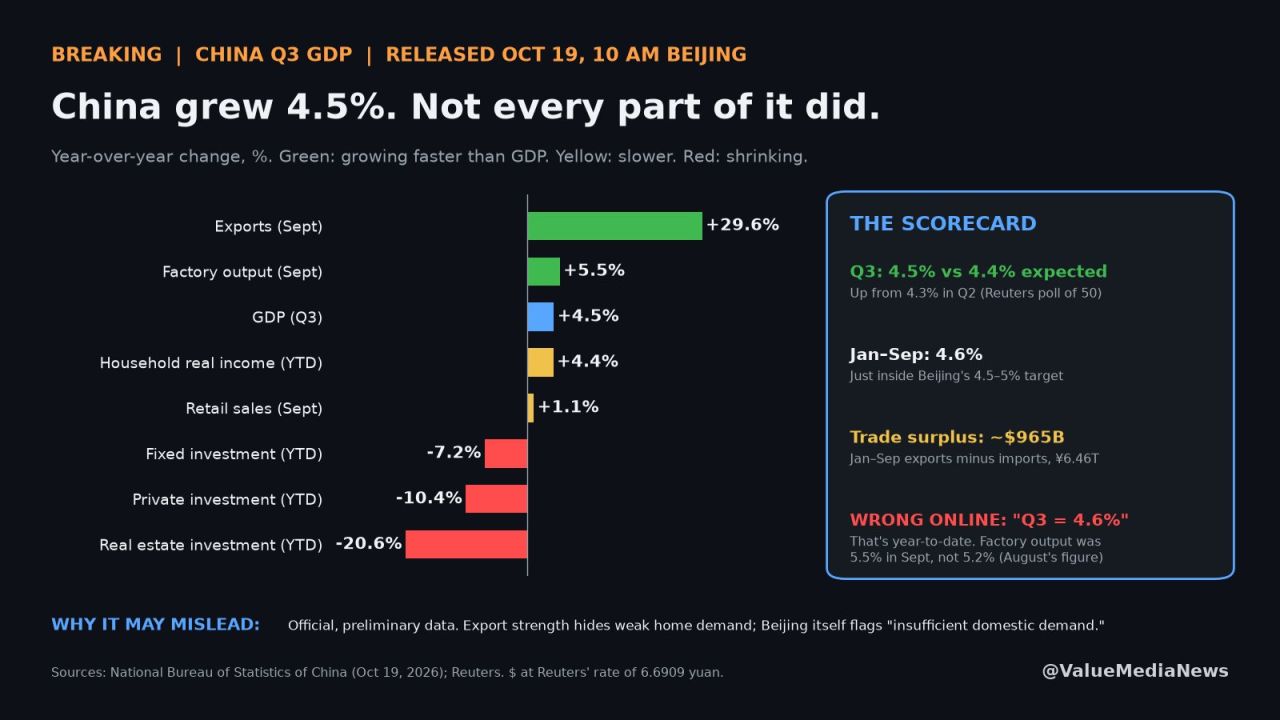
China's economy grew 4.5% last quarter, a hair above forecasts. Factories and exports carried it. Shoppers and home builders didn't.
THE NUMBERS (China's statistics bureau, Oct 19) • Q3 GDP: +4.5% vs a year ago, up from 4.3% in Q2. Reuters poll expected 4.4% • Jan–Sep: +4.6%, just inside Beijing's 4.5–5% target • September exports: +29.6% (yuan terms) • September factory output: +5.5% • September retail sales: +1.1% • Real estate investment, Jan–Sep: −20.6%. Private investment: −10.4% • Urban unemployment: 5.2%, down from 5.3% THE FACTS • Growth did pick up for the first time this year: 5.0% in Q1, 4.3% in Q2, 4.5% in Q3 • Exports beat imports by about ¥6.46 trillion in Jan–Sep, roughly $965 billion • Households' real income rose 4.4%, slower than the economy • Source: https://lnkd.in/e9MskBzs NUANCE These are official, preliminary numbers, and outside economists have long questioned how smooth China's GDP data looks. The growth also leans on selling to the rest of the world, which is exactly what's fueling trade fights with the US and Europe. Retail sales at 1.1% say Chinese consumers still aren't spending. Can an economy keep growing on exports alone when its own shoppers won't spend? Source: Value Media News @ValueMediaNews
Federal Reserve Bank of New York President John Williams said he still sees one more interest-rate hike as appropriate this year
However, at the moment, he does NOT believe it will be necessary for the central bank to increase rates again in 2027. John Williams is widely considered a centrist on monetary policy, though he often tilts dovish compared to the rest of the market Source: Gregory Daco

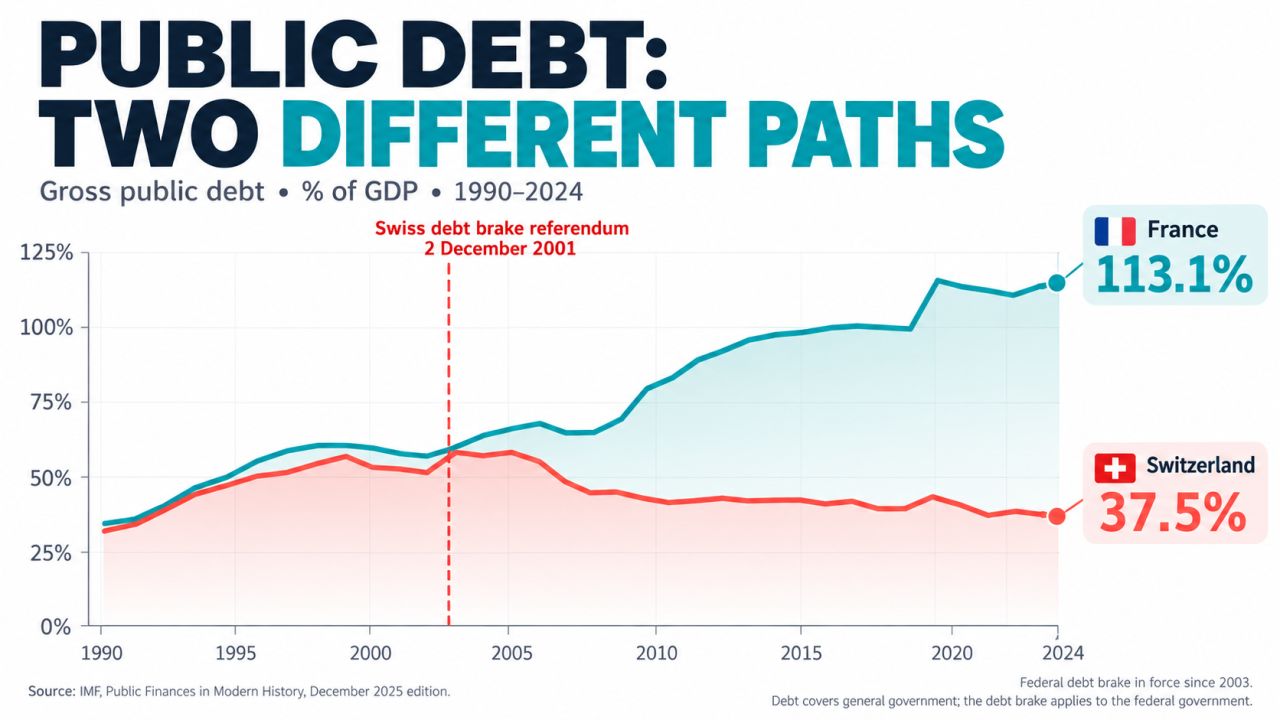
Yes, fiscal discipline is achievable. Switzerland offers a powerful example.
France’s fiscal troubles dominate the headlines. Yet its neighbour deserves more attention. Switzerland wasn’t always a model of sound public finances. During the 1990s, federal debt surged. Then came a turning point. In 2001, 85% of Swiss voters approved a constitutional “debt brake”, implemented in 2003. The principle is simple: → Save when the economy is strong. → Allow deficits during downturns. → Balance spending and revenues over the economic cycle. → Permit exceptional spending during major crises. The results? Federal debt fell from 56.2% of GDP in 2003 to 37.5% in 2024. Economic growth and rising revenues helped. The rule provided a framework that constrained persistent deficits while preserving room to respond to shocks. Switzerland and France have different institutions. Copying a rule alone would not guarantee the same outcome. But the Swiss experience challenges the idea that rising debt is inevitable. Fiscal discipline requires more than promises. It requires credible rules—and the political commitment to respect them. Should Switzerland feature more prominently in Europe’s fiscal debate? Source: Riccardo Trezzi
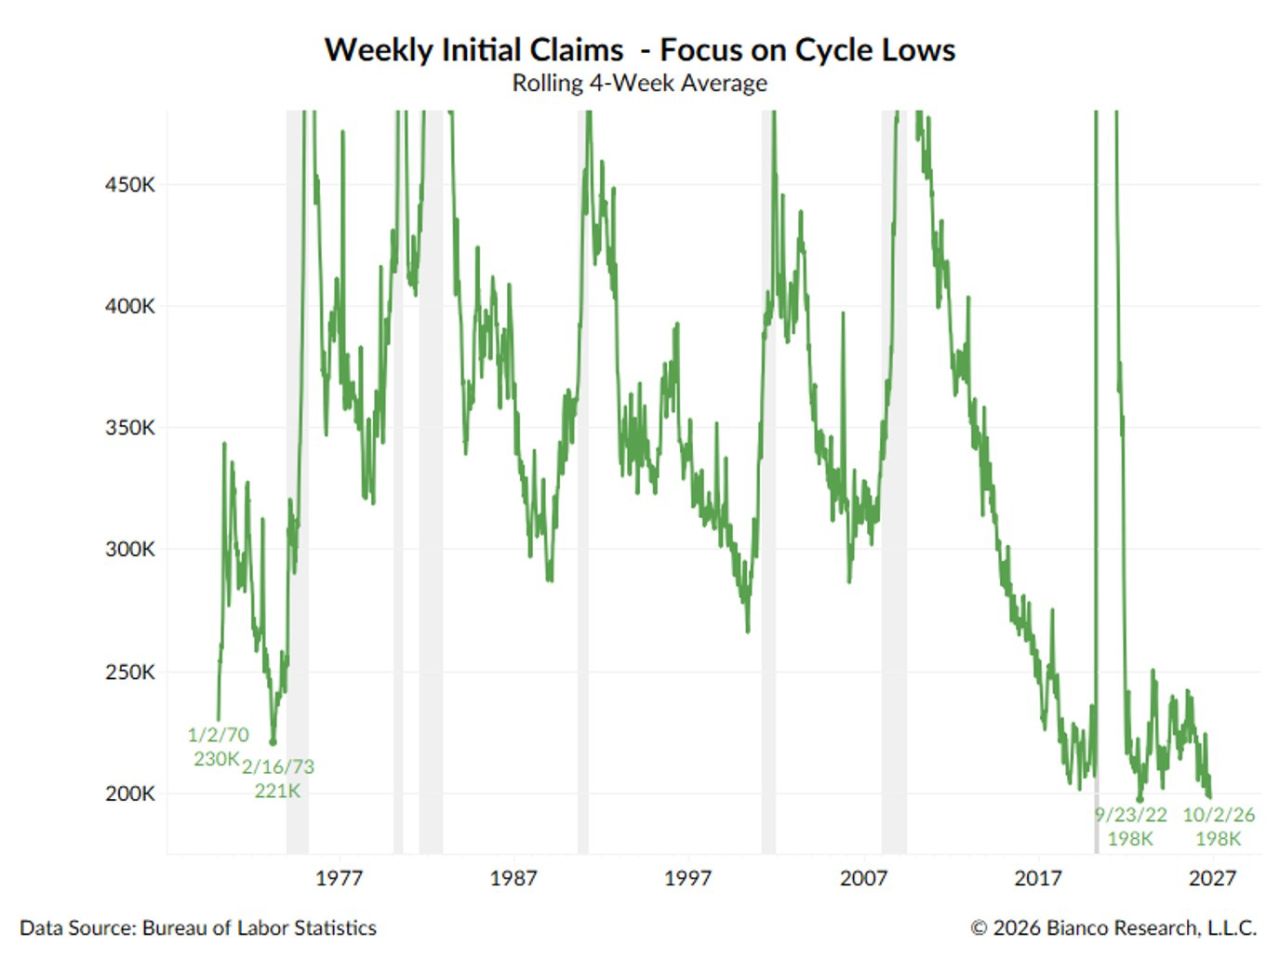
The 4-week average of initial claims equaled its lowest level ever (57 years).
I cut off the peaks so we can better see the troughs. -- For decades, this was THE gauge to measure the labor market. Now it's making a case this is the best US labor market in our lifetime... Source: Jim Bianco
ALL 19 Fed officials BACKED a 25bp RATE HIKE in September.
Most officials also said ANOTHER rate increase would likely be appropriate by YEAR-END. Almost all saw inflation risks tilted to the upside, with some warning the AI investment boom could push demand beyond supply and add further price pressure. The Fed also sees the labor market near full employment, while financial conditions remain supportive despite higher Treasury yields. Source: Coinbureau

SEPTEMBER U.S. JOBS REPORT CAME IN FAR WEAKER THAN EXPECTED
• Nonfarm Payrolls +29K vs Est. +90K • Unemployment Rate 4.2% vs Est. 4.1% • Avg. Hourly Earnings 3.0% vs. Est. 3.1% Given the massive undershoot in the NFP, rate hike probabilities have completely flipped. There is now a 71% chance of no hikes in October. One week ago, it was 35%. Nasdaq futures, Gold & Bitcoin spiked on the news. Source: coinbureau,

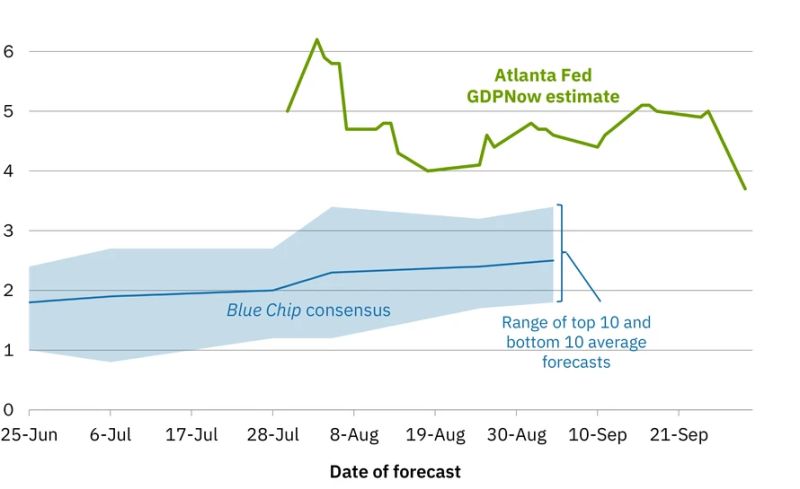
Atlanta Fed GDPNow estimate for Q3 GDP drops to 3.7%, from 5.0% on September 25
Source: zerohedge