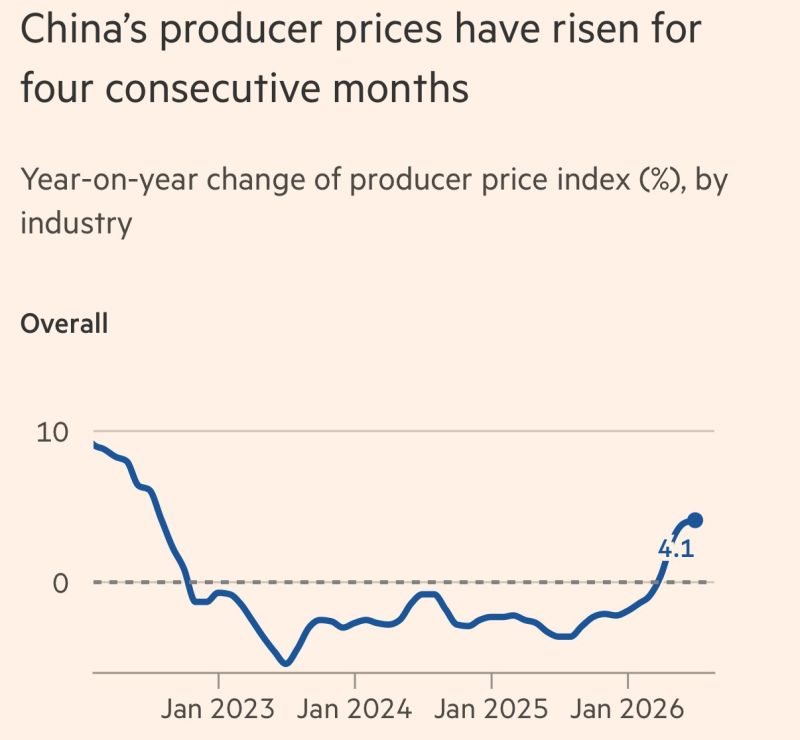
In case you missed it... China's factory inflation hits a near 4-year high.
China's Producer Price Index (PPI) rose 4.1% YoY in June, the highest reading since July 2022 and the 4th consecutive monthly increase. Consumer inflation slowed to 1.0% from 1.2% in May, highlighting weak domestic demand even as manufacturers face rising input costs. Higher energy prices during the Iran conflict were the main reason producer prices increased. Source: Bull Theory, FT
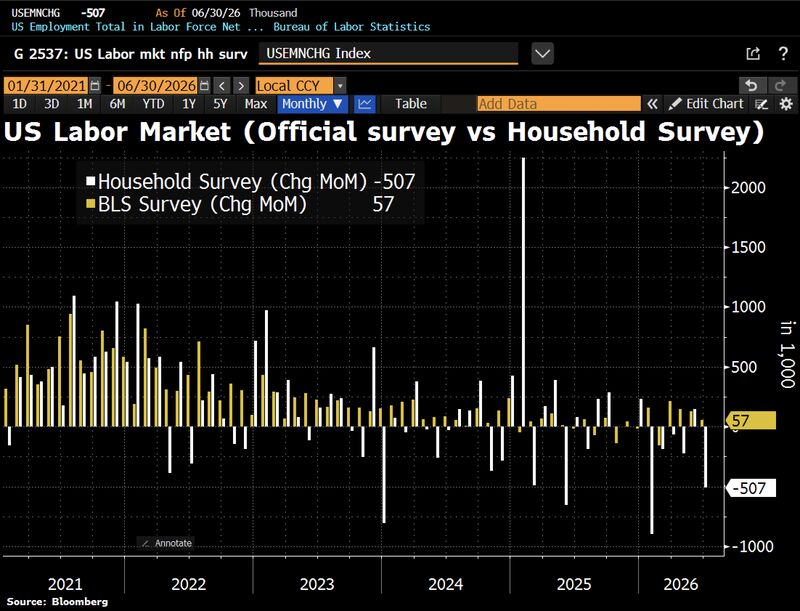
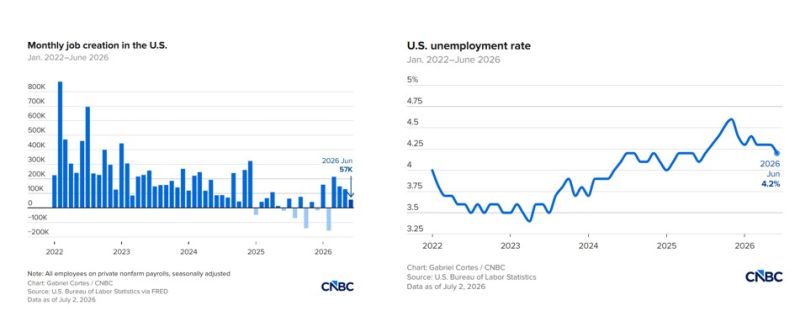
US jobs report screams slowdown beneath the headline: payrolls rose just 57k, but the household survey showed employment plunging 507k and the labor force collapsing 720k.
Unemployment fell to 4.2% for the wrong reason: participation cratered to 61.5% from 61.8%. Source: Holger Zschaepitz Bloomberg
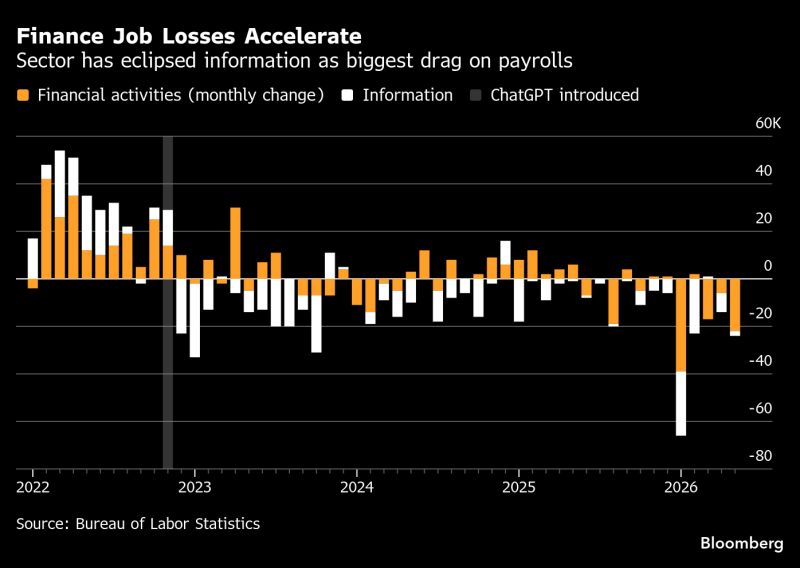
The U.S. financial activities and information sectors are shedding almost 30,000 jobs a month so far in 2026, recession-level figures equivalent to a 20% drag on broader job growth.
Finance in particular is heavily exposed to automation given its job mix. Source: Matthew B @boes_ Bloomberg
The U.S. labor market just sent its weakest signal in months.
June payrolls rose by only 57,000, well below expectations of 115,000 and down sharply from May's revised 129,000. At first glance, the unemployment rate improved to 4.2%. But the headline masks growing weakness. The labor force participation rate fell to 61.5%, its lowest level since March 2021, while household employment plunged by 507,000 people in a single month. Wage growth remained resilient, with average hourly earnings rising 0.3% month-over-month and 3.5% year-over-year, suggesting inflationary pressures have not fully disappeared. Under the surface, the picture is mixed: 📈 Professional & business services: +36K 📈 Social assistance: +25K 📈 Healthcare: +22K 📈 Government: +8K But leisure & hospitality LOST 61,000 jobs 🚨, despite expectations that the World Cup would boost seasonal hiring. The labor market is no longer collapsing. But it is clearly cooling. For the Fed, this report strengthens the case that growth is slowing, even if wage pressures remain sticky. Source: CNBC
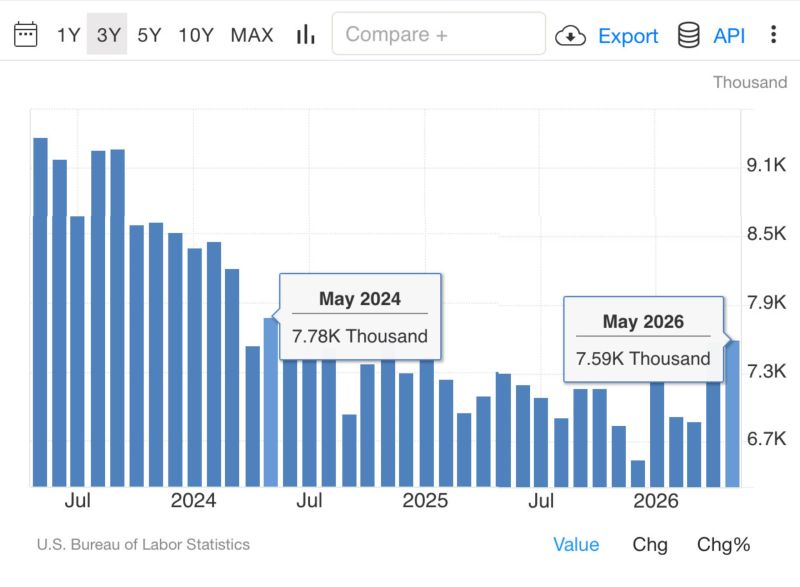
In case you missed it... JOLTs job openings just hit a 2-year high, and that's why the market is reacting positively.
May job openings came in at 7.594 million, well above expectations. A stronger labor market lowers recession risk, but it also gives the Fed less reason to cut rates soon. Markets are still reading it as a soft landing signal, and that's enough to bring risk appetite back. Source: Bull Theory
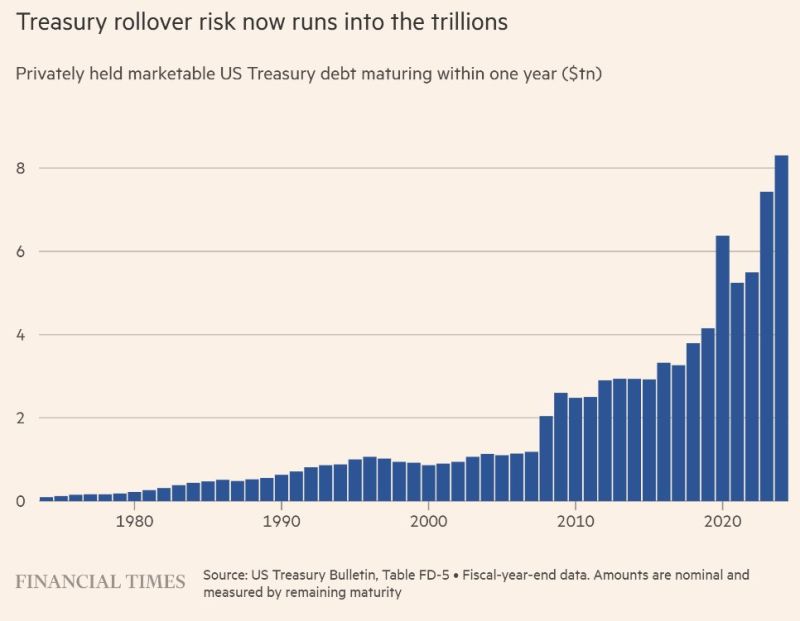
The US can't afford much higher interest rates.
Here's why: Over the next 12 months, the US Treasury must refinance roughly $8 trillion of debt. The average interest rate on that debt is about 3.3%. Today, the 1-year Treasury yields around 4%. Simply refinancing that $8 trillion at current rates would increase annual interest costs by roughly $50 billion. And that's before accounting for interest on an ongoing $2 trillion annual budget deficit. This is why today's fiscal backdrop is fundamentally different from the early 1980s. When Paul Volcker raised rates into the double digits, the US had already benefited from years of high inflation that dramatically reduced the debt burden relative to the economy. Today, debt levels are far higher. Every percentage point increase in borrowing costs has a much larger impact on the federal budget. The Fed isn't just fighting inflation anymore. It's operating with one eye on a balance sheet that has become increasingly sensitive to higher rates. The higher rates stay, the more expensive America's debt becomes. Source: Lukas Ekwueme @ekwufinance FT
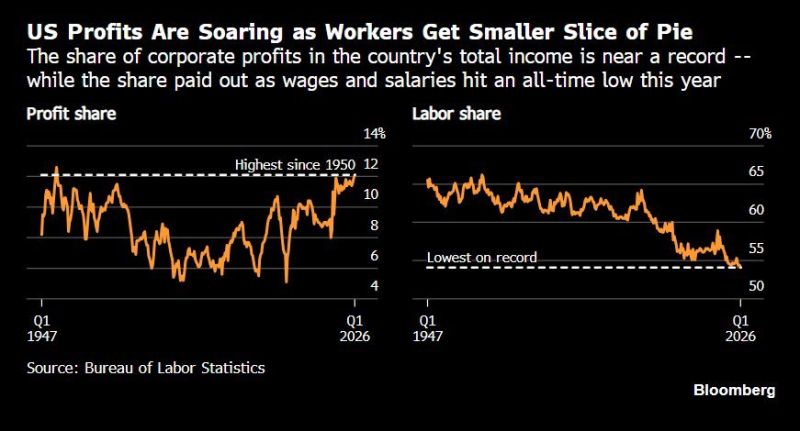
The K-Shaped economy:
Source: Hedgeye, Bloomberg
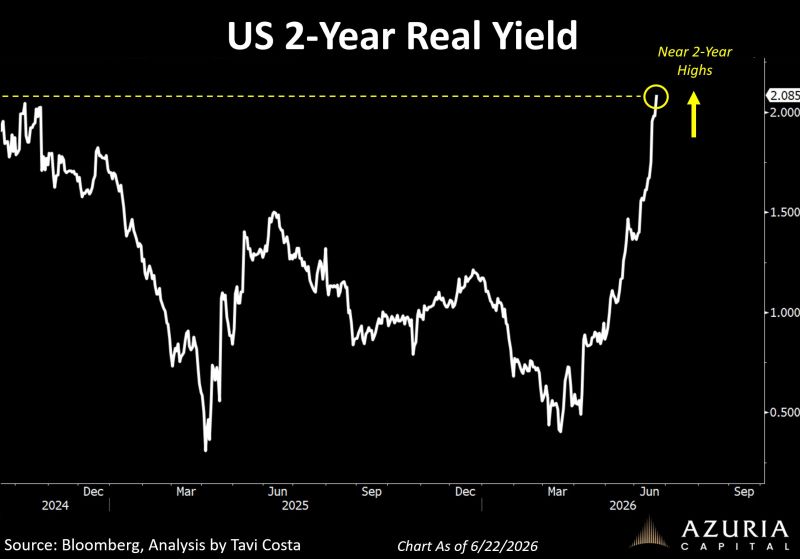
Real yields continue to go vertical. Now at two-year highs.
In an economy facing a mountain of debt, this is not a great development... The new Fed Chair does not have an easy job... Source: Tavi Costa