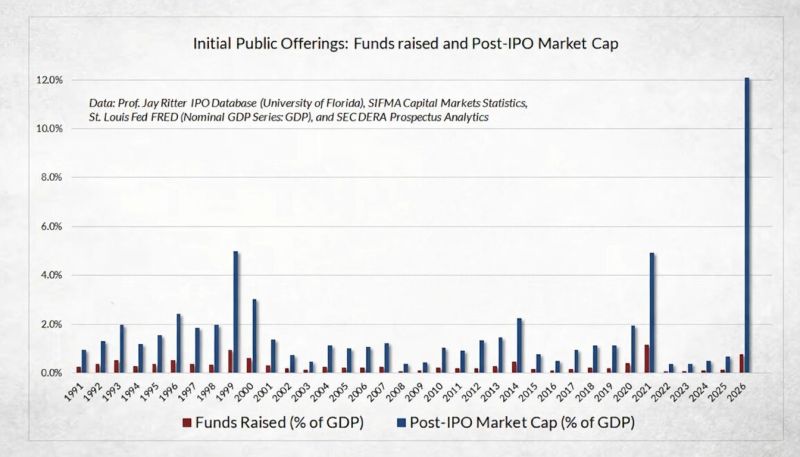
A record amount of IPOs in 2026 as the billionaires rush to cash out.
Source: Financelot
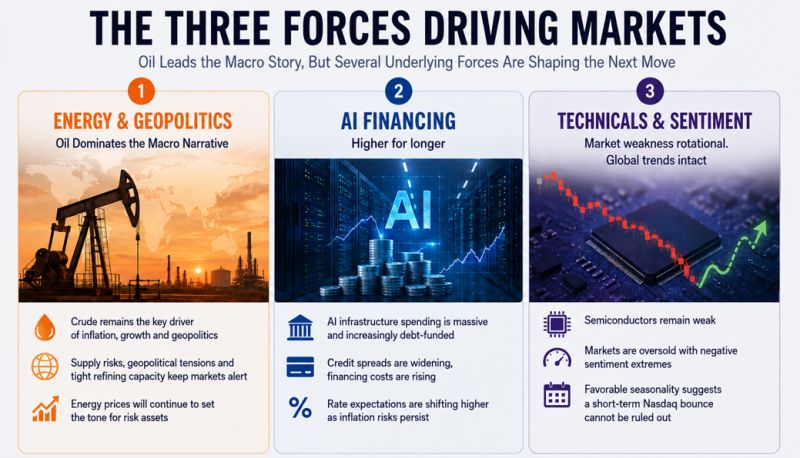
The three forces driving the market
Oil continues to dominate the macro narrative, but beneath the surface several other themes are gaining importance. AI financing is becoming a growing concern for credit markets, rate expectations are shifting higher, technicals across semiconductors continue to weaken, while an oversold setup and favorable seasonality suggest a short-term bounce in Nasdaq cannot be ruled out. Source: TME
Yesterday was a terrible day for Mag7 stocks, down almost 5% on the back of GOOGL's plunge (the Mag7 stocks lost almost $800 Billion in market cap on a single day).
This was the worst day for Mag7 since April '25 (Liberation Day) and the basket index broke below all its major moving averages. What's remarkable is that despite that decline, the semis (SOXX) are basically unchanged. Source: zerohedge, Finviz
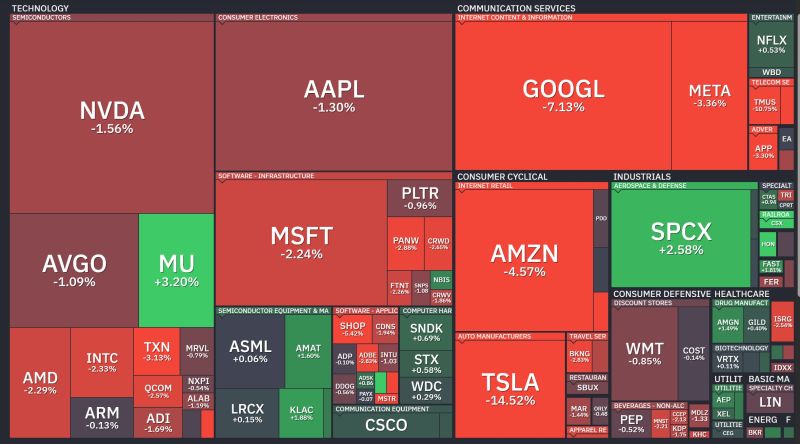
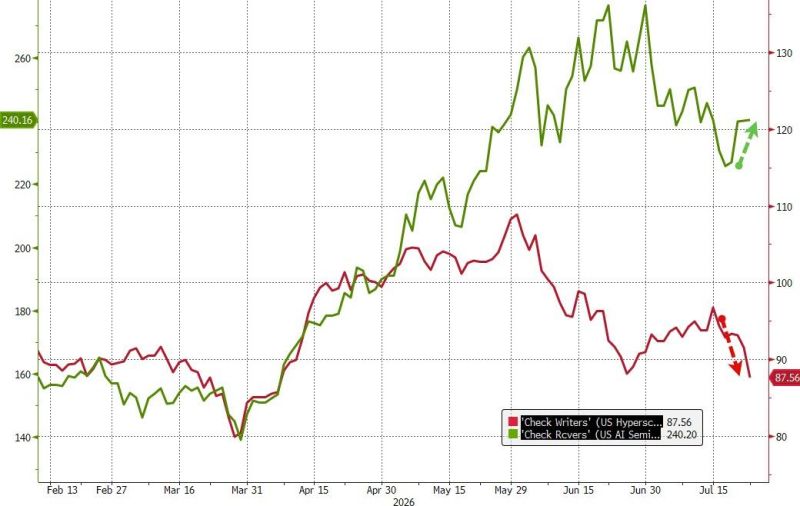
The narrative of 'punish the spenders
(the hyperscalers - in red below) and celebrate the receivers' (the semiconductors - in green below) is still ongoing. Source: zerohedge
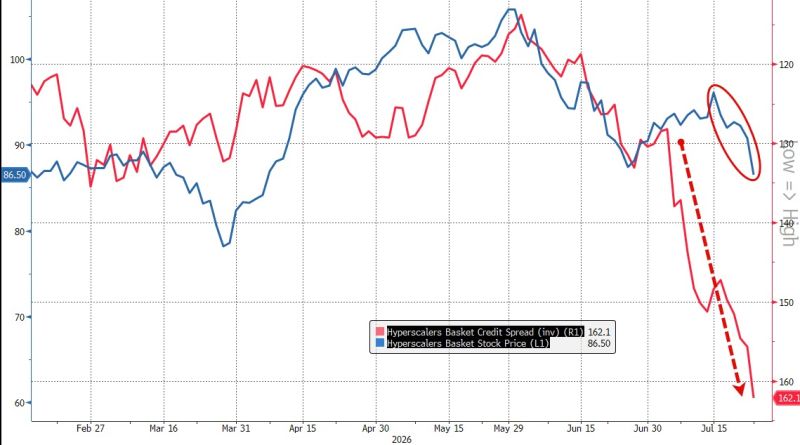
Carnage in hyperscaler bond land:
Investment Grade bond spreads for hyperscalers are exploding every day, as credit investors refuse to fund memory chip purchases any longer. CDS (inverted in red on the chart below) are following. How long will it take for the hyperscaler stocks (in blue) to follow ? Source: zerohedge
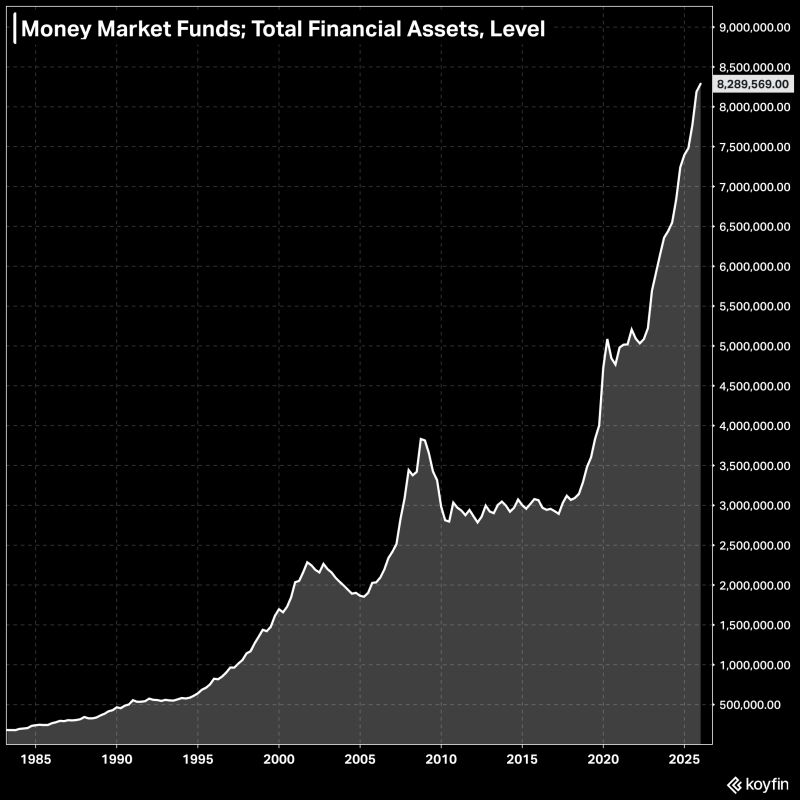
There is a record $8.29 trillion in money market funds right now.
Source: Koyfin
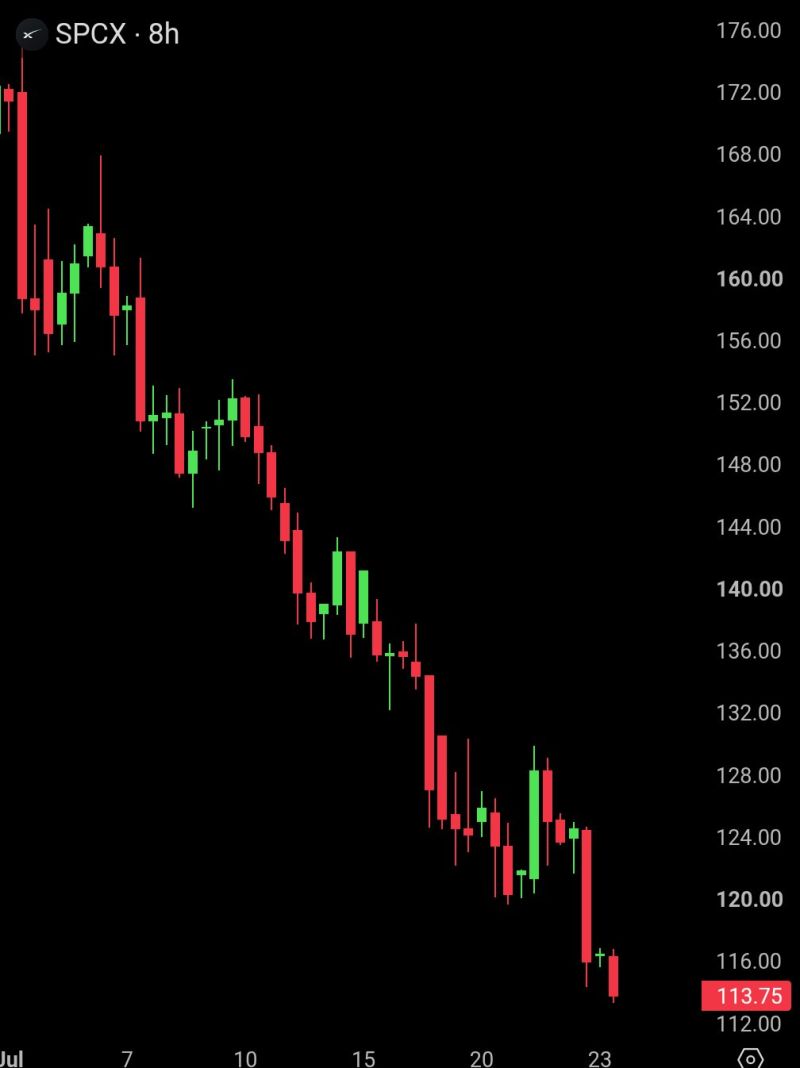
$1.48 TRILLION has been wiped out from SpaceX $SPCX in the last 37 days, as it hits a new all-time low.
Source: Bull Theory
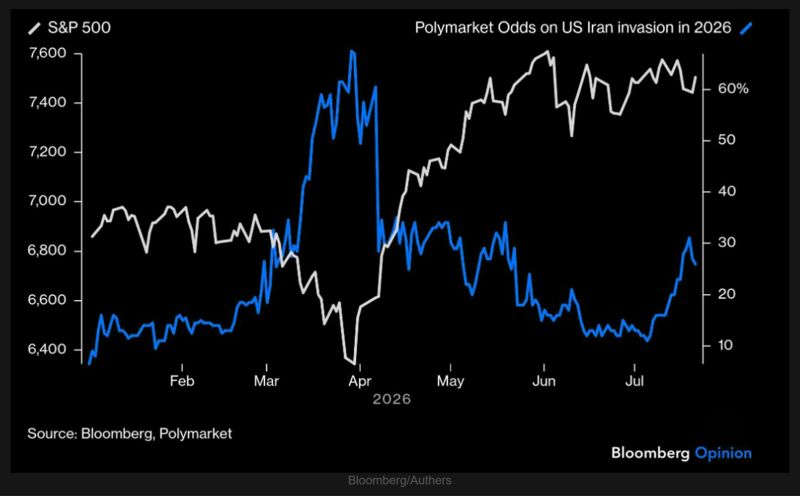
Prediction markets sharply lowered the perceived odds of a ground invasion, helping fuel a strong rally in the S&P 500.
Following conciliatory remarks from Iran and President Trump's announcement of a bombing pause earlier this year, investors concluded that neither side had the appetite for a prolonged ground conflict. Those odds have started to climb again, however, even as equities remain relatively resilient. Source: TME, Bloomberg/Authers