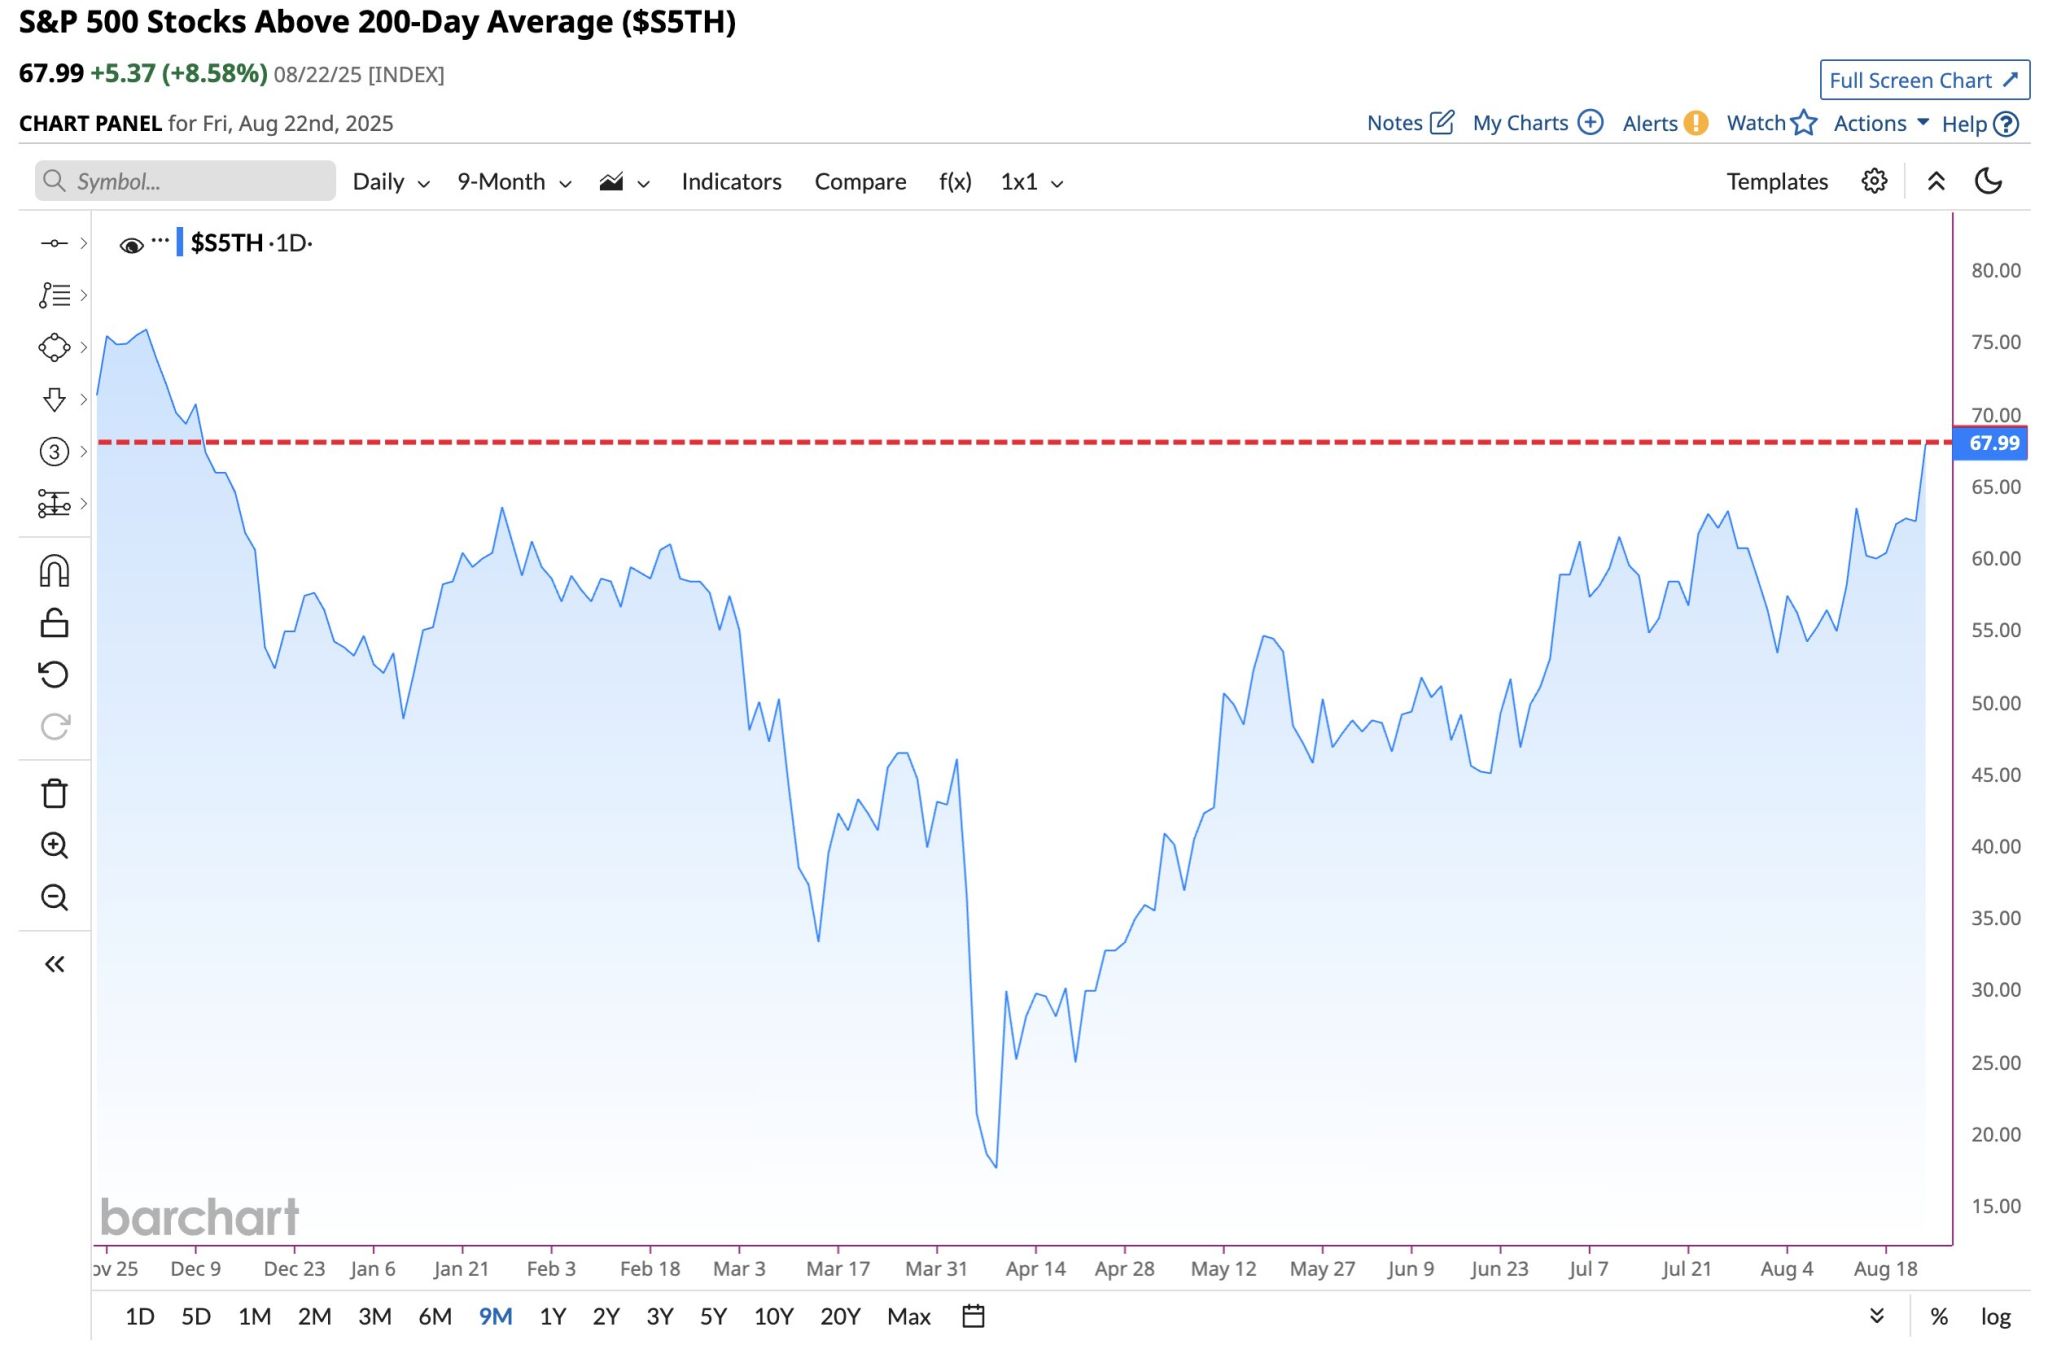
SP500 market breadth has been improving
Indeed, 68% of S&P 500 stocks are now trading above their 200-day moving average, the most this year 📈 Source: Barchart
A friendly reminder of bitcoin seasonality
Source: Ryan Rasmussen @RasterlyRock, Bitwise Asset Management

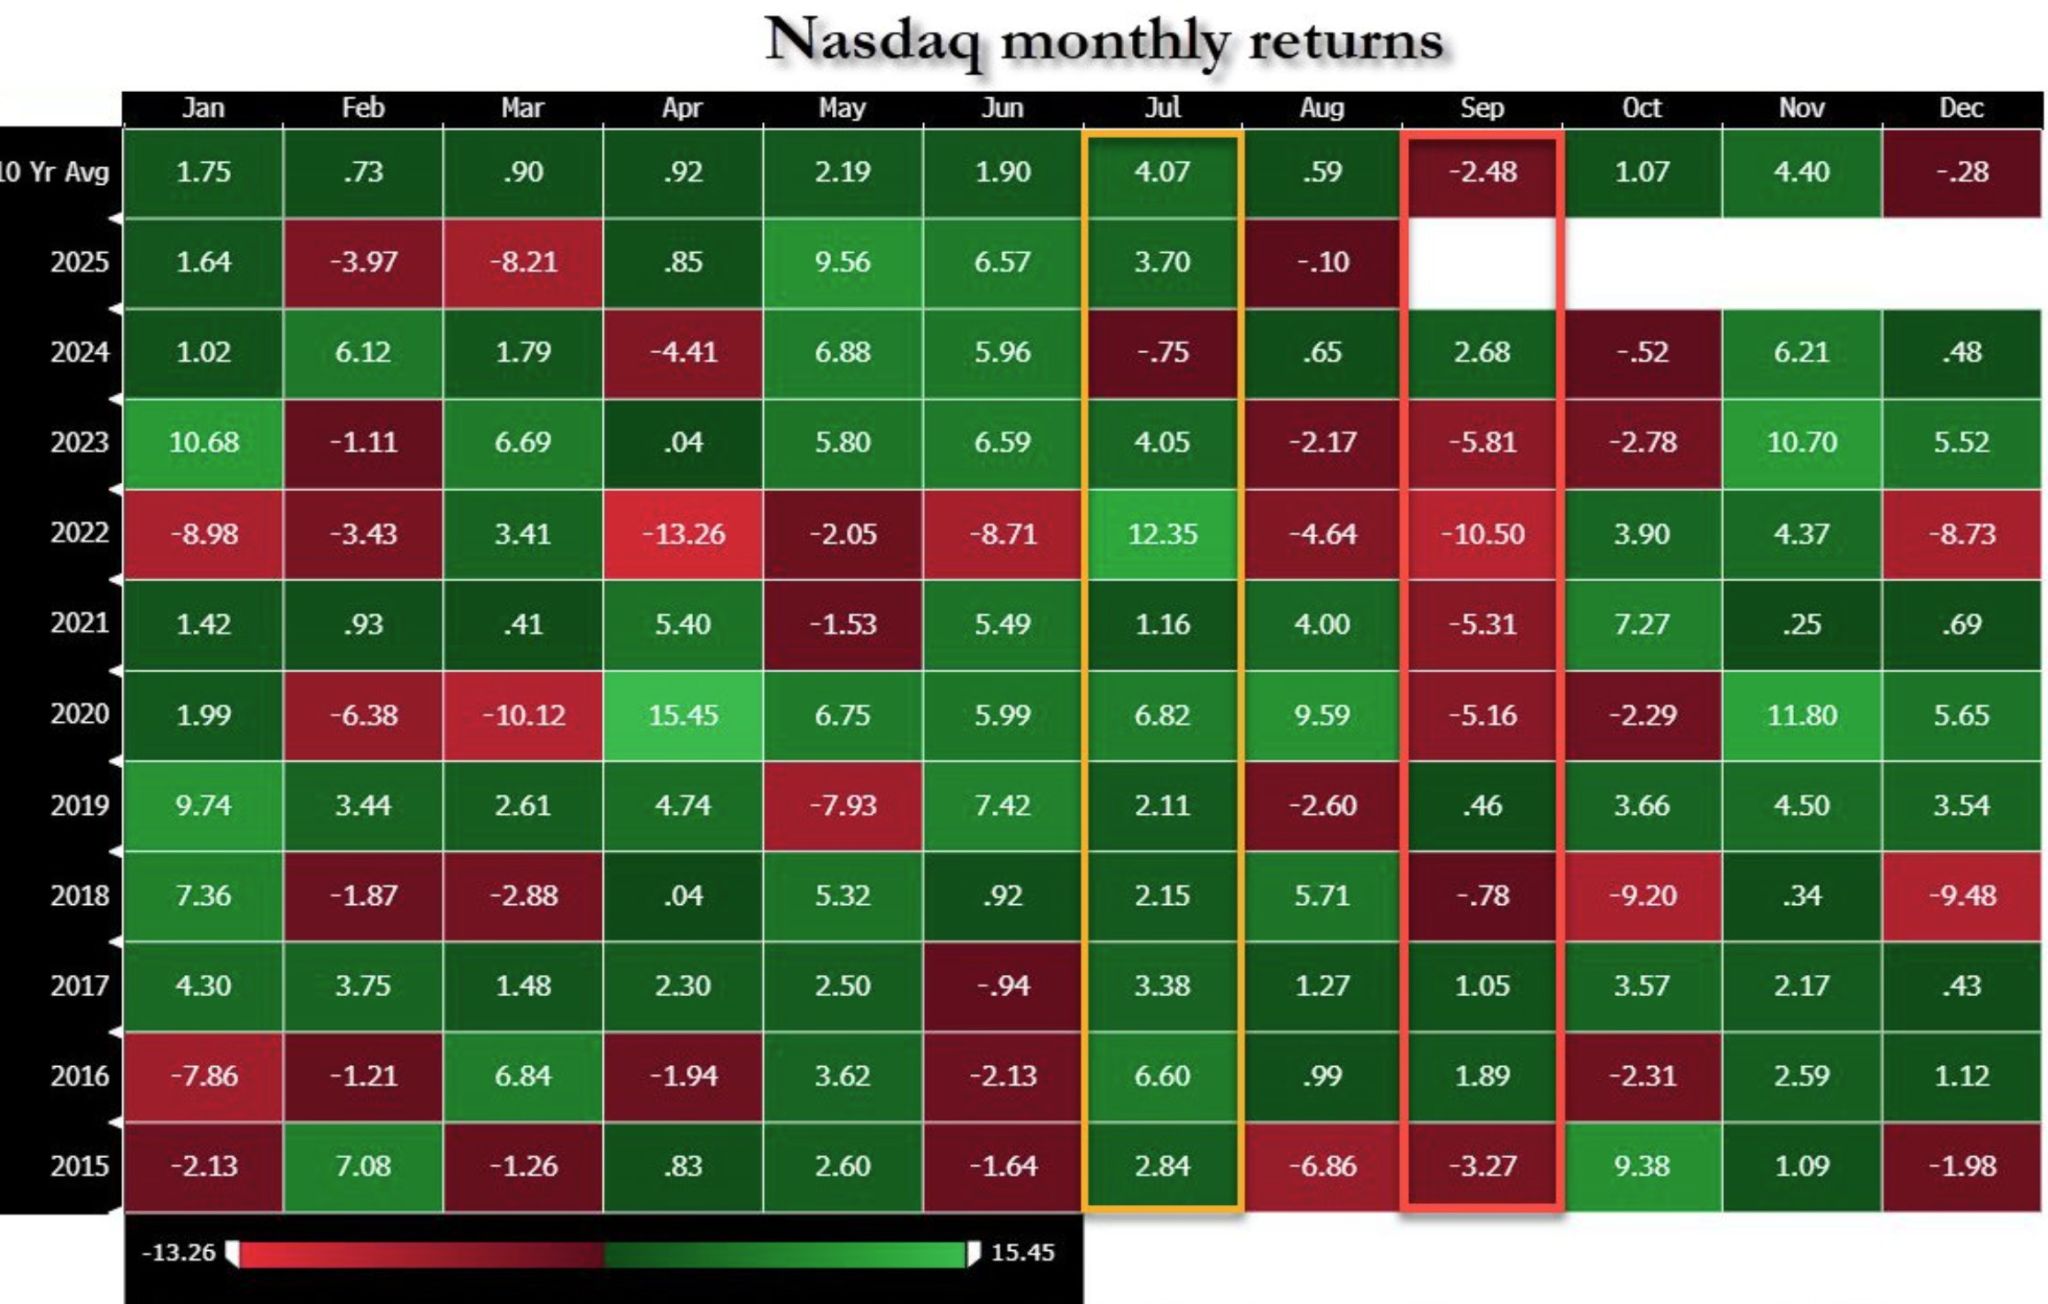
July Nasdaq seasonals were great. September's are not.
Source: zerohedge
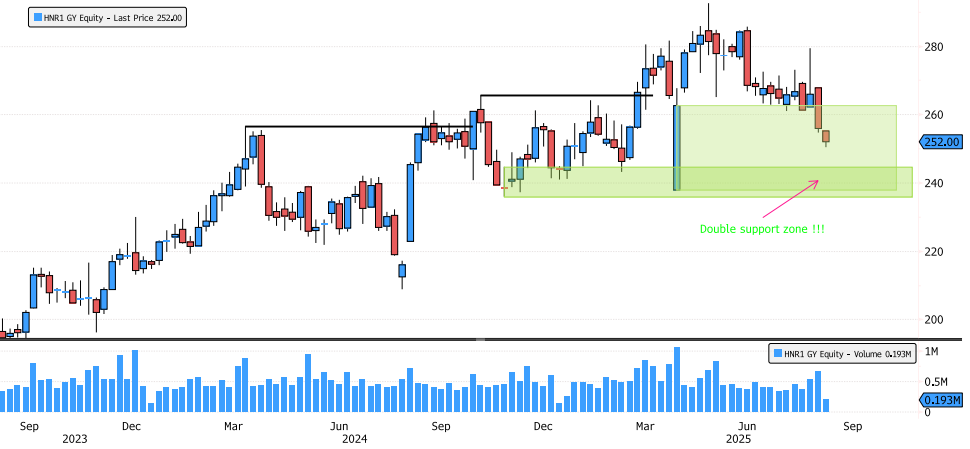
Hannover Rück Approaching Double Support Zone
Hannover Rück has been in a bullish long-term trend since 2012! The last swing has consolidated 15% since the May highs, nearing the 78.6% Fibonacci retracement. The stock is now entering the major weekly swing support zone between 238-262, while also approaching the second major support zone from the January 2024 swing at 236-244. Keep an eye on the price action to confirm the potential end of this consolidation. Source: Bloomberg
Salesforce in a Good Spot!
Salesforce (CRM) has been consolidating since December 2024 and is now down 38%. The stock is back in the major swing support zone between 212-273. Last week was particularly interesting, with a break below the April lows creating a liquidity grab and a reversal, forming a Hammer candle. Source: Bloomberg

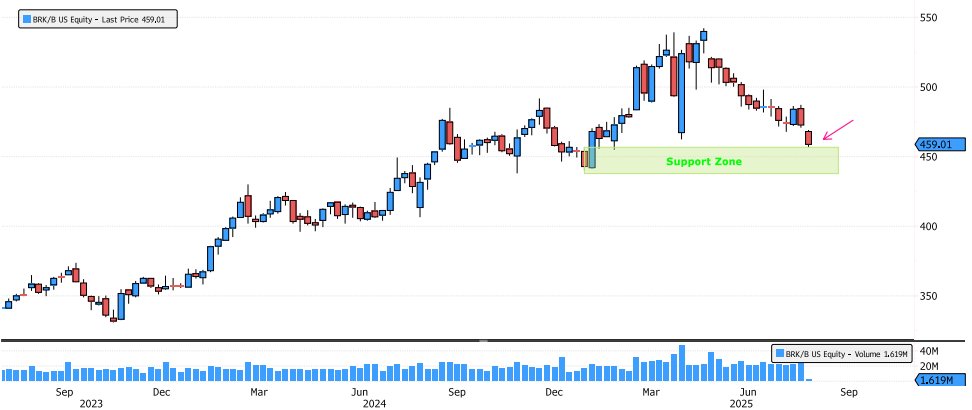
Berkshire Reaching Major Support Zone
Berkshire Hathaway has consolidated more than 15% since the May highs and is now approaching the major swing support zone between 440-456. Keep an eye on the price action over the next few days for potential developments. Source: Bloomberg
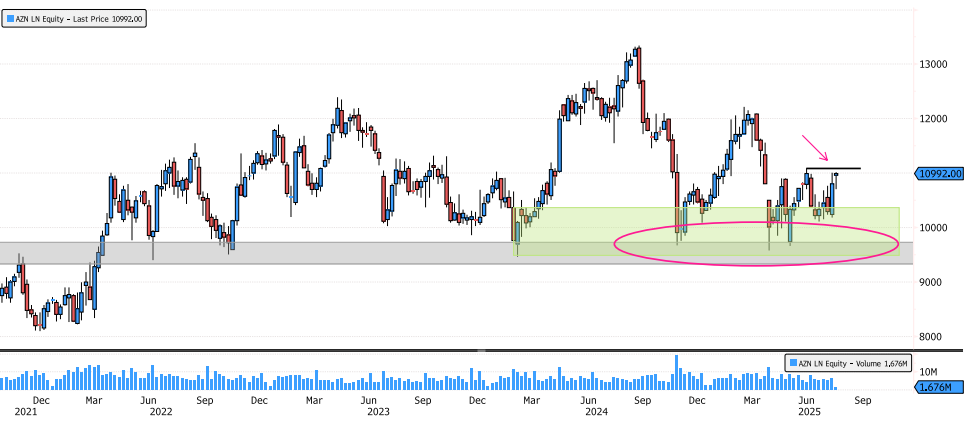
AstraZeneca Trying to Breakout
After several months of rebounding from the major support zone between 9330-9730, AstraZeneca is now showing signs of a potential breakout. Keep an eye on the 11086 resistance for any confirmation of the breakout. Source: Bloomberg
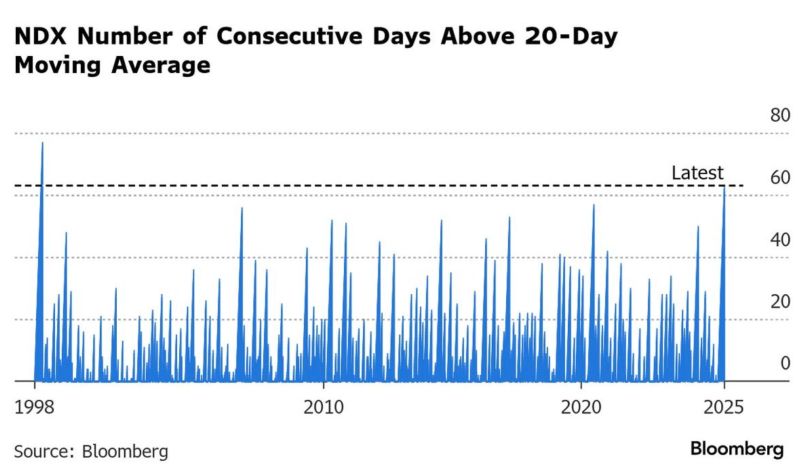
Nasdaq posted its 63rd consecutive day above its 20-day moving average, the longest streak since the dot com bubble.
Source: zerohedge, Bloomberg