Straight from the Desk
Syz the moment
Live feeds, charts, breaking stories, all day long.
- All
- equities
- United States
- Macroeconomics
- Food for Thoughts
- markets
- Central banks
- Fixed Income
- bitcoin
- Asia
- europe
- investing
- geopolitics
- technical analysis
- gold
- Commodities
- Crypto
- AI
- Technology
- nvidia
- ETF
- earnings
- Forex
- china
- Real Estate
- oil
- banking
- Volatility
- energy
- magnificent-7
- apple
- Alternatives
- emerging-markets
- switzerland
- tesla
- United Kingdom
- Middle East
- assetmanagement
- amazon
- microsoft
- russia
- ethereum
- ESG
- meta
- Industrial-production
- bankruptcy
- Healthcare
- Turkey
- Global Markets Outlook
- africa
- Market Outlook
- brics
- performance
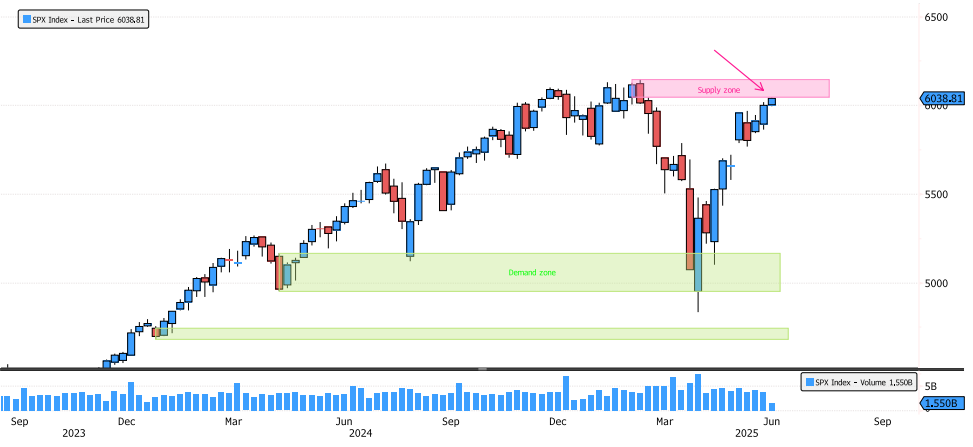
S&P 500 Index Entering Supply Zone
After a stunning 25% rebound in just 1 month, the S&P 500 is now entering the supply zone between 6047-6147. Will it have enough strength to break through this level and post a new high? Source: Bloomberg
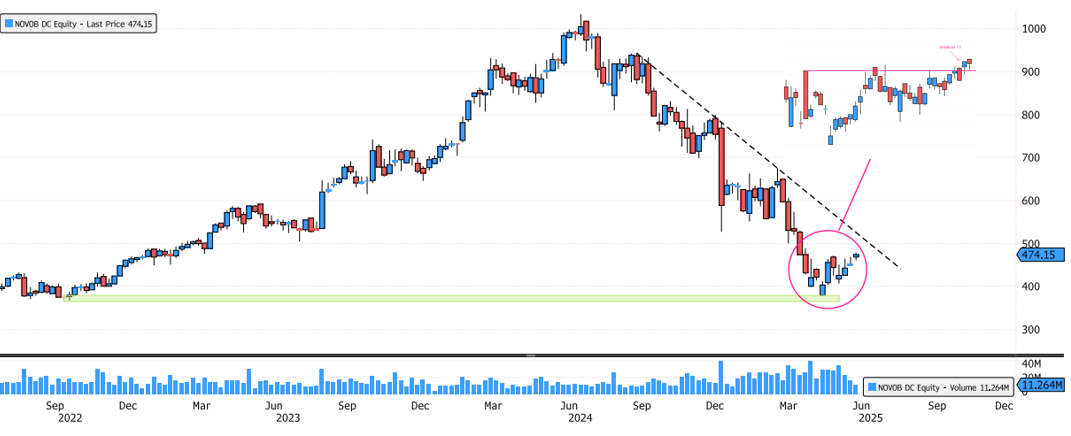
Novo Nordisk First Positive Sign in Bear Market
For the first time since June 2024, Novo Nordisk saw a positive close yesterday! While the long-term bearish trend hasn’t reversed yet, we’re seeing positive developments on the daily chart. The weekly chart remains bearish. The end of April rebound from the support zone between 365-380 is encouraging, but we’ll need more price action to confirm these first steps. Source: Bloomberg
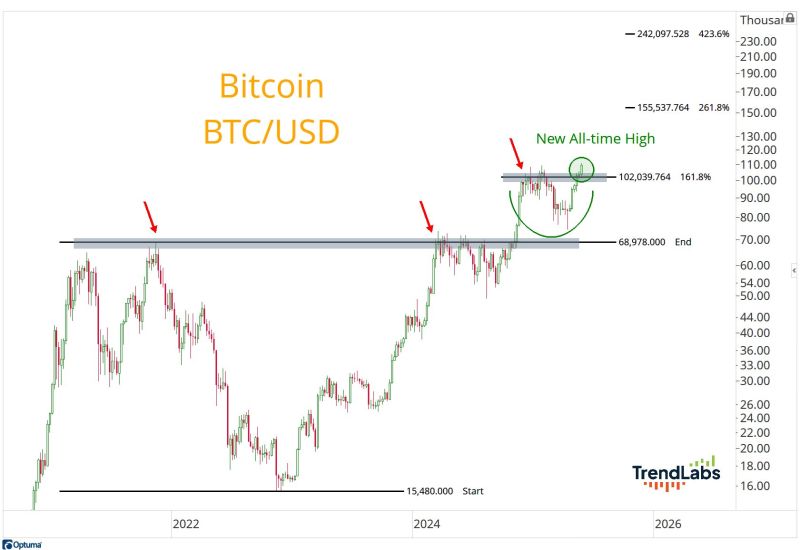
Bitcoin technicals by J-C Parets
Satoshi Nakamoto passes Nvidia CEO Jensen Huang to become the 11th richest person in the world.
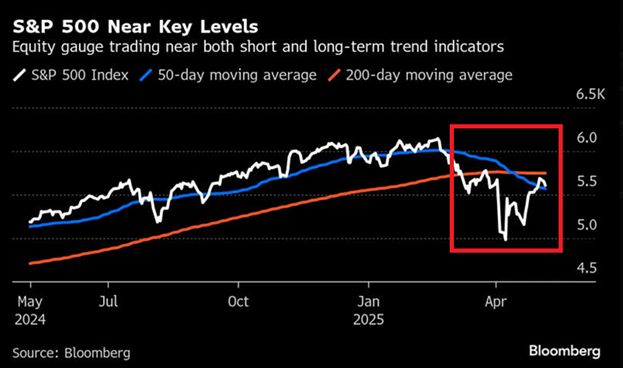
‼️The S&P 500 is trading at a MASSIVE technical level:
The S&P 500 has recovered some losses and broken above its 50-day moving average for the first time since February. However, it is still trading below its key 200-day moving average, a level smart money is watching. Will progress on US-China tariffs help the market break key resistance levels? Source: Bloomberg, Global Markets Investor
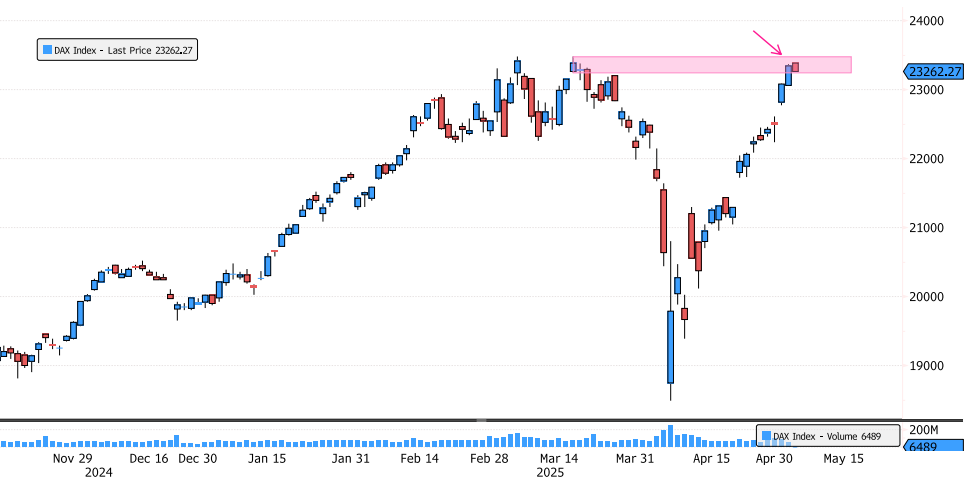
DAX Index Reaching Ultimate Supply Zone
The DAX Index has now rebounded 26% since the lows! Will the market be able to break through the last supply zone between 23,240-23,476? Keep an eye on the price action and support at 23,133. Source: Bloomberg
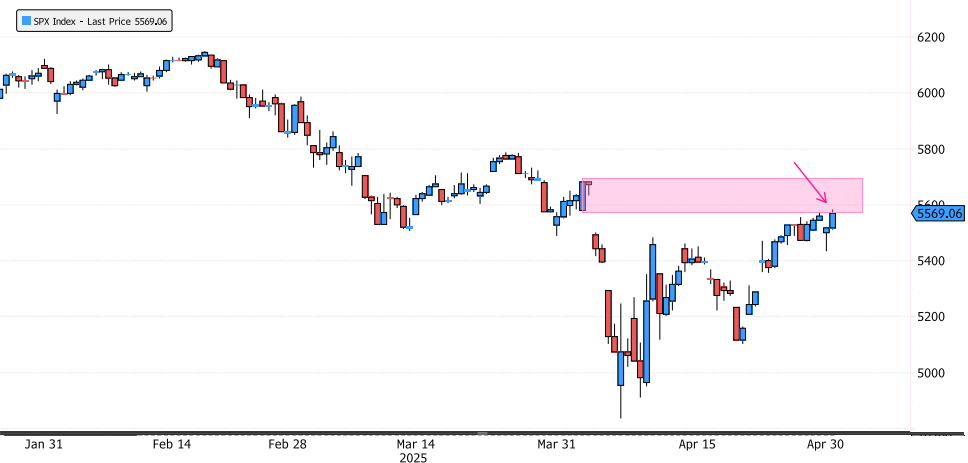
S&P 500 Index Back on 1st Supply Zone
The S&P 500 Index has rallied 17% since the lows and is now back on the 1st important supply zone between 5571-5695. Will it be able to close above 5695? Keep an eye on the price action over the next few days. Source: Bloomberg
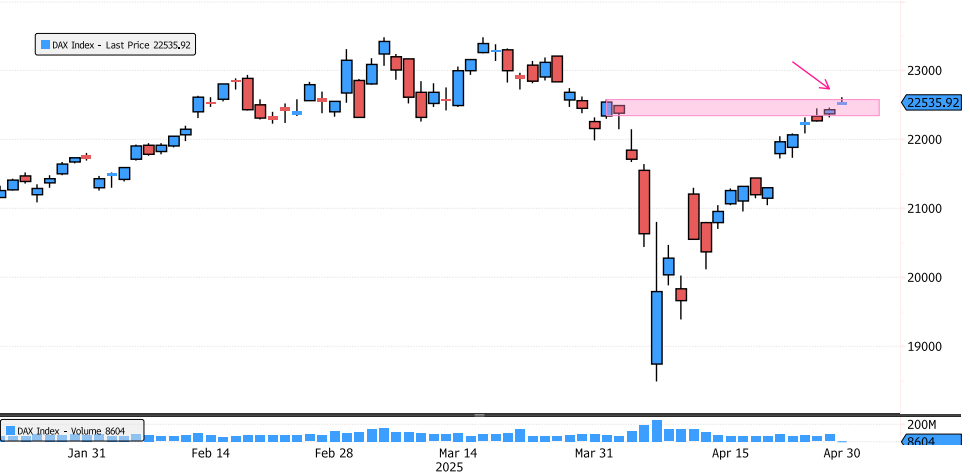
DAX Index Back on 1st Supply Zone
The DAX Index has recovered 22% since the lows in just 17 opening days! It’s now reaching the first supply zone between 22,343-22,573. Will the market be able to close above 22,573? Keep an eye on the price action over the next few days. Source: Bloomberg
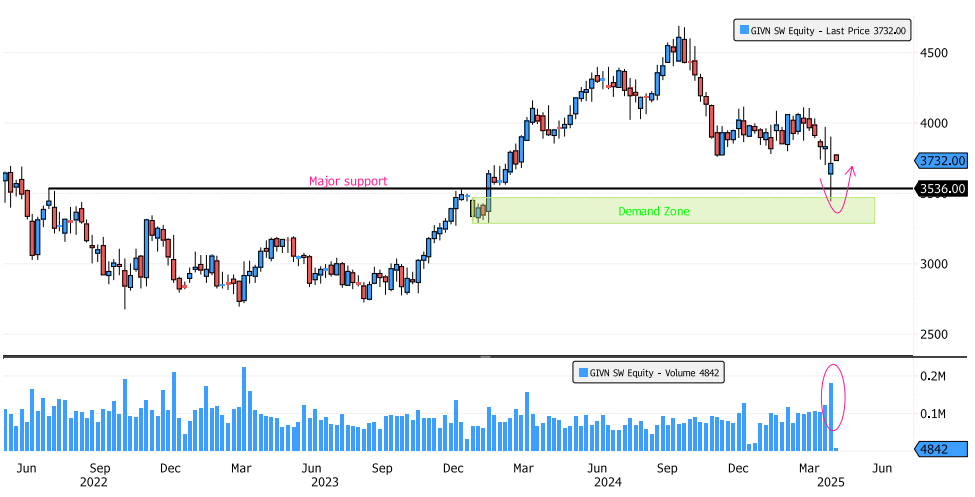
Givaudan Positive Reaction Last Week
Givaudan (GIVN SW) showed a positive reaction last week, rebounding strongly and closing the week above major support at 3536. The stock rebounded sharply from the demand zone between 3287-3468, and has consolidated 26% since the September 2024 high. It’s also at the 61.8% Fibonacci retracement. These technical levels aligning suggest a significant moment for the stock.Source: Bloomberg
Investing with intelligence
Our latest research, commentary and market outlooks


