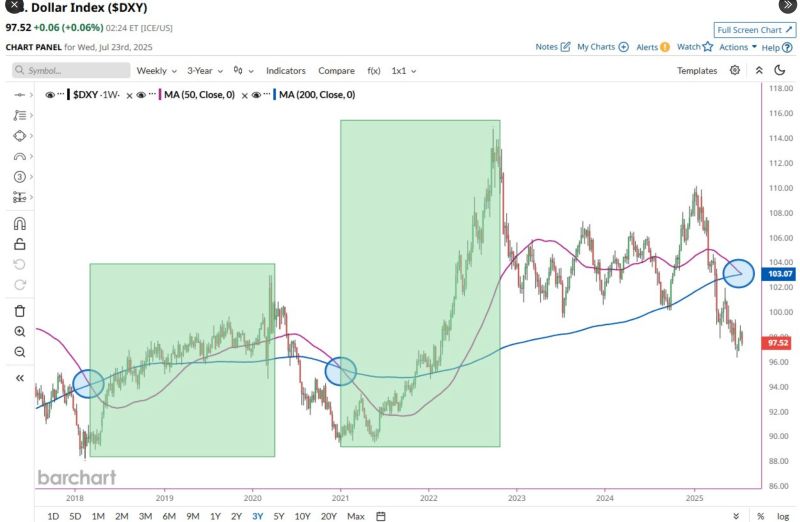
U.S. Dollar Index $DXY on track to get a Death Cross ☠️ on the weekly chart for the first time since January 2021
🚨 The last 2 weekly Death Crosses marked the bottom 📈 Source: Barchart
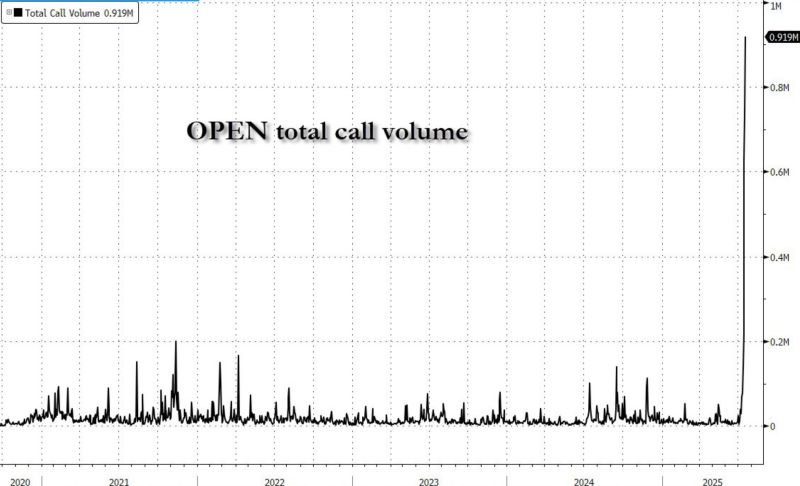
The biggest gamma squeeze in history ???
Source: zerohedge
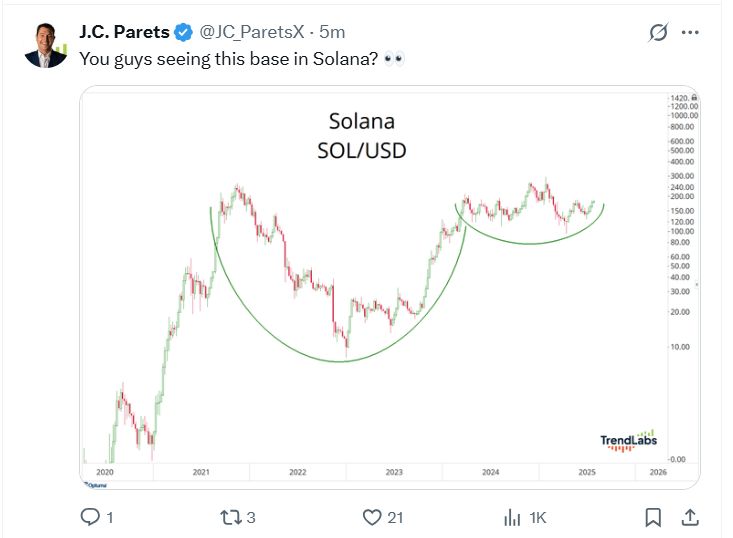
Solana $SOL beaking out from multi-weeks base?
SOL/USD
Ether $ETH relative to bitcoin $BTC is breaking out after a multi-month consolidation.
Is this bearish for bitcoin? No. It just means that we might be at the beginning of the so-called "altcoin season" where other cryptos start to outperform bitcoin. But it does NOT mean that bitcoin is heading south. The new all-time highs in Coinbase, Robinhood and other crypto-related stocks and assets like Galaxy Digital are additional evidence that the crypto bull market might actually gathering speed. Source. J-C Parets NB: this is not an investment recommendation. Do your own research
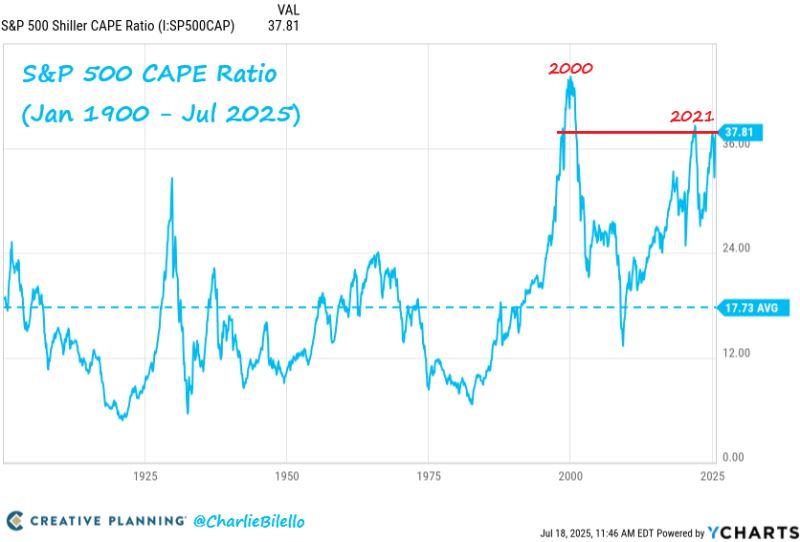
The SP500's CAPE Ratio is about to cross above 38 for the 3rd time in history, now higher than 98% of historical valuations. $SPX
Source: Charlie Bilello
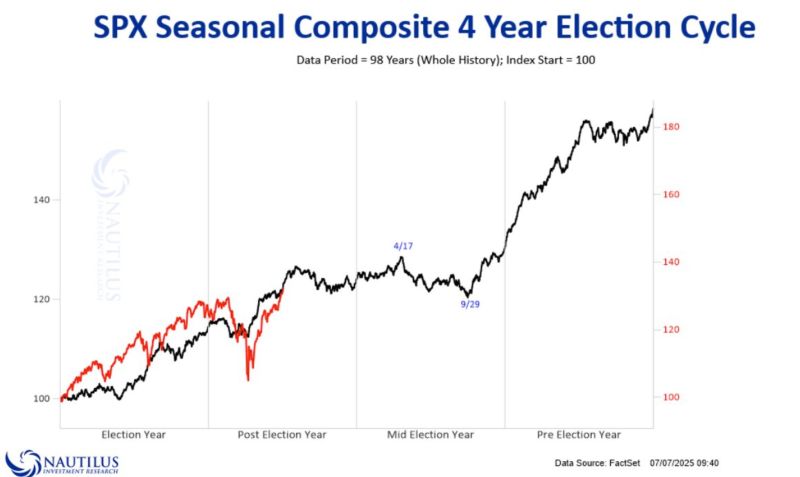
Nautilus Research ➡️ 2025 vs. 4-year Election Cycle Composite.
A last "hurrah" before some troubles ahead?
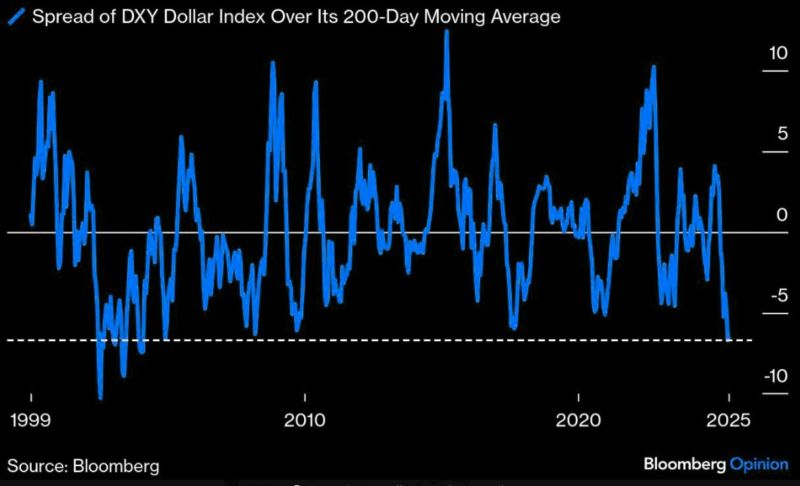
BREAKING: U.S. Dollar
U.S. dollar Index $DXY is now trading below its 200 Day Moving Average by the largest margin in 21 years. Source: Bloomberg
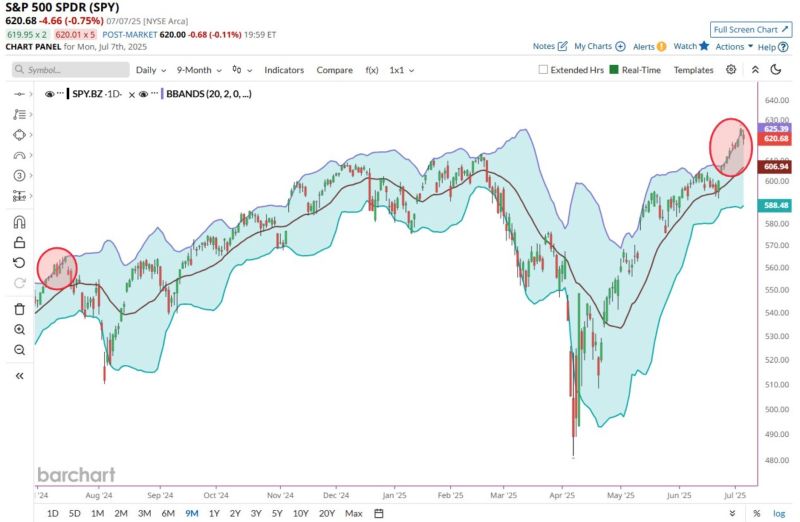
The SP500 has traded above its upper Bollinger Band for the past 8 days.
The last time it did that was in July 2024 and then $SPY promptly corrected by 10%. Source: Barchart