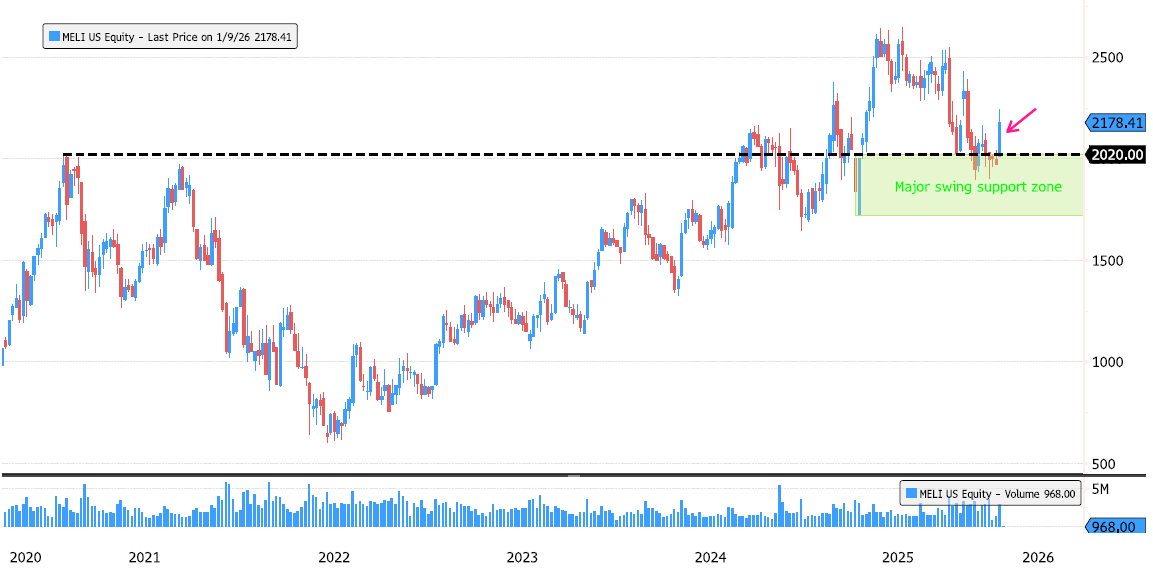
MercadoLibre bouncing off a major long-term level
After a +28% consolidation from the July 2025 highs, MercadoLibre (MELI US) is showing constructive technical signals. 🔹 Price has pulled back to the 78.6% Fibonacci retracement 🔹 A double bottom is forming on the last swing support zone 1,724 – 2,020 🔹 This area is technically critical: - Former 2021 highs - A 5-year consolidation zone - Strong historical demand level This confluence makes the current zone a key structural support, worth close monitoring for confirmation of a medium-term rebound.
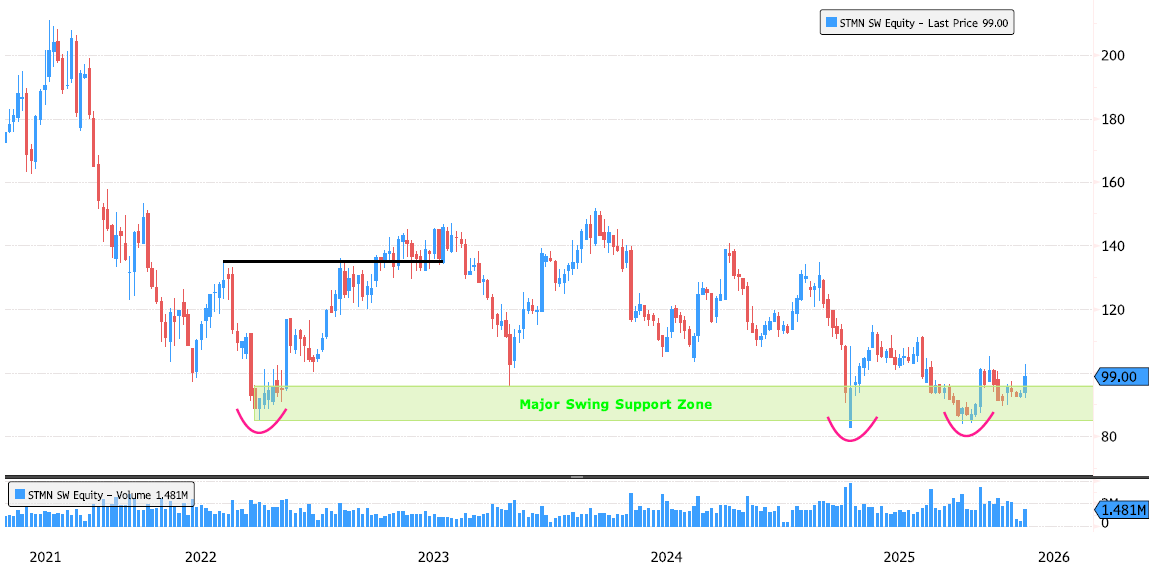
Straumann — Is a low forming?
Back in March 2023, the trend flipped from bearish to bullish after a ~59% consolidation over 10 months. Following nearly two years of another consolidation, we’re now seeing early signs of a bottoming process. 📊 Key technical observations: Strong volume reaction on the major swing support zone (85–95) Structure suggesting a potential inverted Head & Shoulders Still early-stage, but clearly one to monitor closely 🎯 Next resistance: 105.25 If confirmed, this setup could lay the groundwork for the next bullish leg. Confirmation remains essential. Source: Bloomberg
⚠️ Silver – Bearish Reversal Day Alert
Silver (XAG) is printing a bearish engulfing pattern today — one of the most reliable reversal signals in technical analysis. 📈 Context matters: The market has rallied more than +50% since the ~50 level last November. Price is trading in all-time high territory, where profit-taking and volatility often increase. 🧠 What this suggests: A consolidation would be healthy and logical at this stage. A 50% Fibonacci retracement of the recent leg points toward a potential target around 64.78. Such a move would help the market rebuild energy rather than signal a trend break. 🔎 Big picture: Long-term trend remains bullish. However, the market likely needs more fuel before attempting a sustainable continuation higher. ➡️ In short: stay cautious in the near term, respect the signal, and watch how price behaves during any pullback. Source: Bloomberg

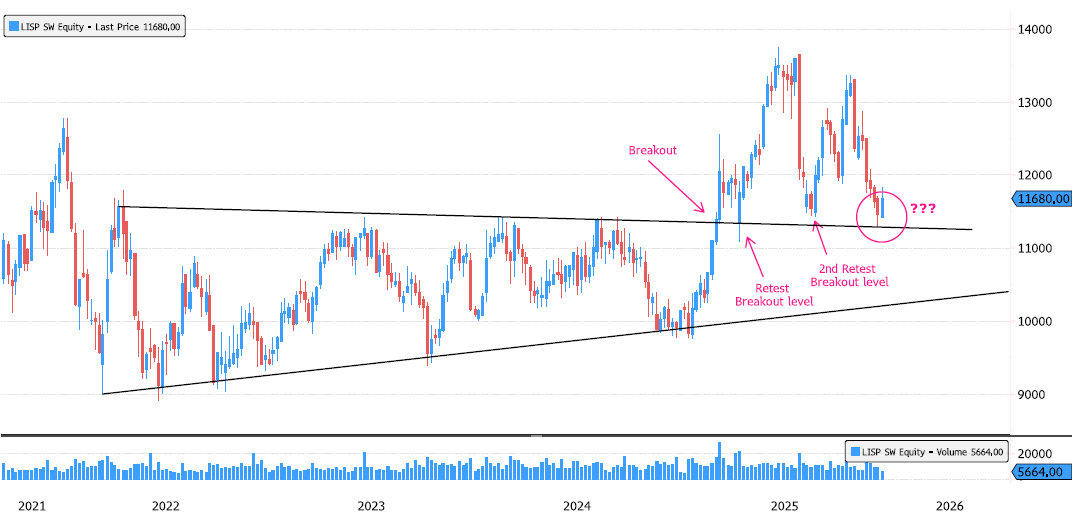
Chocoladefabriken Lindt back on major level
Back in August, I highlighted that Lindt had corrected more than 16% from the June highs and was retesting the 11’090–11’750 support zone, a key area aligned with the February breakout level. - Fast forward to today, and the stock is once again back on this exact same support. - This repeated test reinforces the importance of the zone: - It remains a major reference level in the broader uptrend Buyers have previously stepped in here, confirming it as a structural support The question now is whether this area can attract demand once again or if the market needs further consolidation before resuming higher. From a technical standpoint, as long as this support holds, the medium- to long-term trend remains intact. A sustained rebound from this level would once again confirm the strength of the underlying structure. Source: Bloomberg
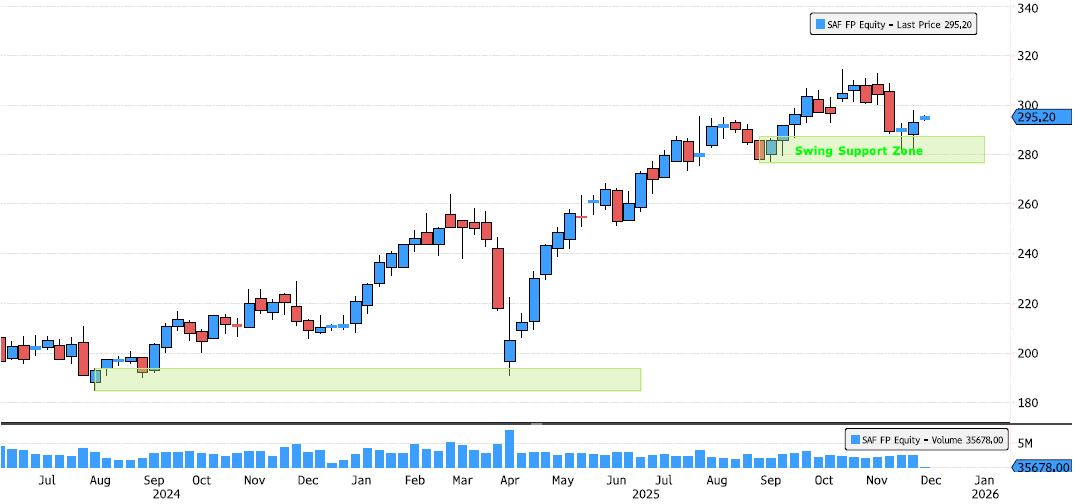
Safran Bouncing Off Swing Support Zone
Safran is showing early signs of strength after a healthy consolidation phase. After a 10%+ pullback since October, the stock is now rebounding off the 276–286 swing support zone. The long-term trend remains firmly bullish, with price action continuing to respect major higher-timeframe supports. Source : Bloomberg
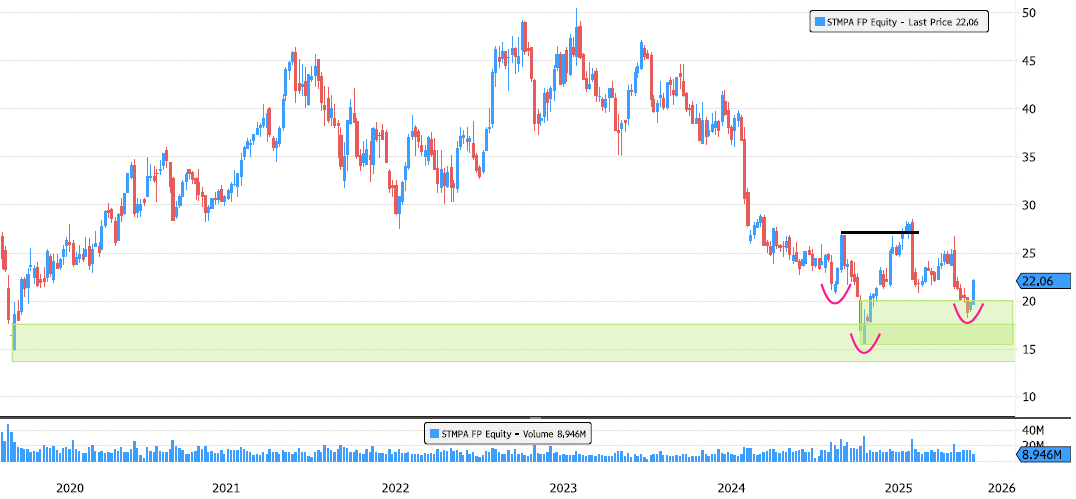
STMicroelectronics : low in place?
After a 69% consolidation from the July 2023 high, STMicroelectronics may finally be showing signs of a structural shift. - April rebound inside the key support zone 13.73–17.55 - Bullish breakout in July, opening the door to a potential trend reversal - Retest of swing support at 15.50–20.07, followed by a higher low formation - Structure improving, but confirmation still needed Keep an eye on volume — it could provide the next confirmation. Source: Bloomberg
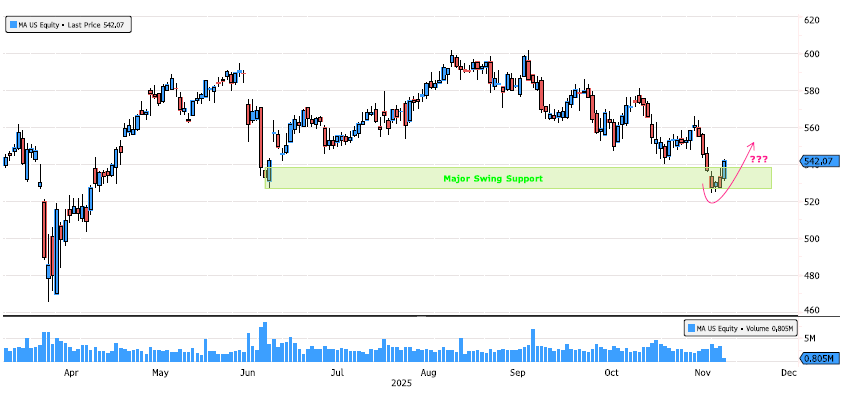
Mastercard rebounding on Swing Support
After a 12% consolidation since the August high, Mastercard is now showing constructive price action on a major swing support zone at 527–538. This area has acted as a strong demand zone in the past — daily and weekly closes will be key to confirm whether buyers are stepping back in with conviction. Source: Bloomberg
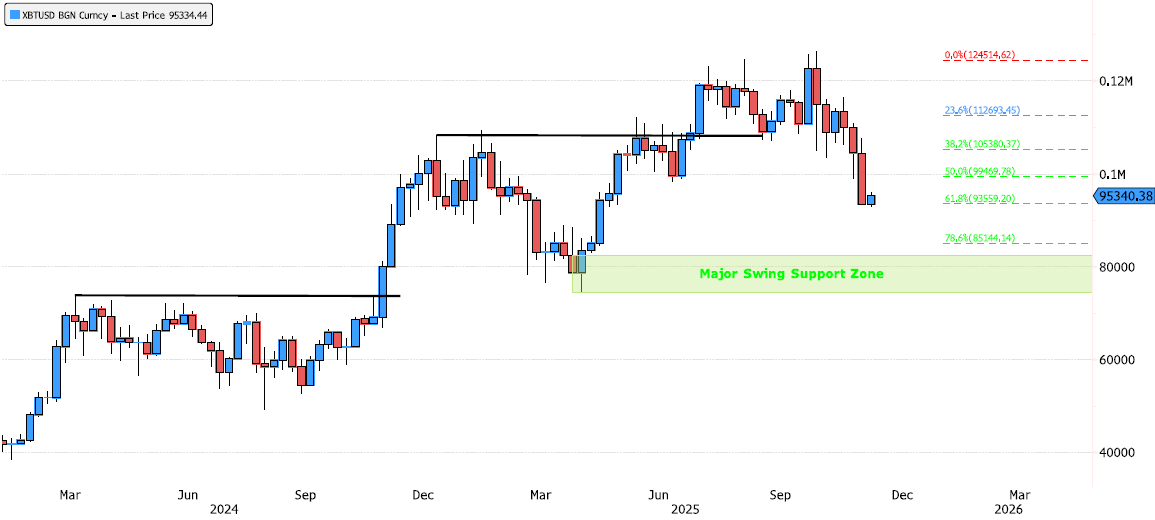
Bitcoin – Next Support Levels
Bitcoin has consolidated 26% since the October highs! Now trading in the discount zone (below the 50% Fibonacci retracement). 👉 Key levels to watch: Imbalance zone: 86'450 – 92'850 Major swing support: 74'424 – 82'531 ⚠️ Critical level that must hold: 74'424 Now it’s all about looking at price action in these key areas. Source: Bloomberg