Charles-Henry Monchau

Chief Investment Officer

Chart #1 — 

A strong month for risk assets 


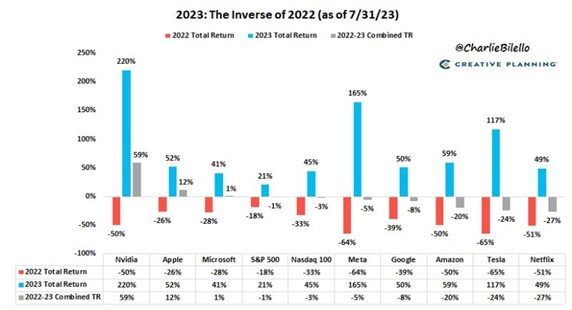
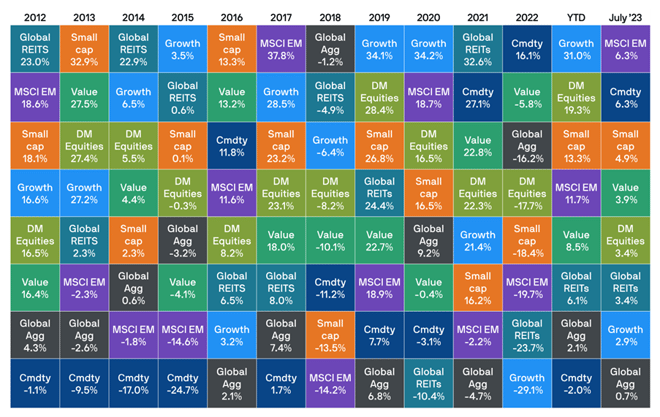
After a mixed performance in June, July was largely positive for assets across the board. The MSCI World (in $) recorded a 3.7% gain over the month. The S&P 500 was up 3.1% ; a 5th straight monthly gain while the Nasdaq advanced by 4.1%. While the strong equity performance in H1 was mainly sparked by the enthusiasm around Artificial Intelligence (AI ), market leadership has been broadening recently as economically sensitive parts of the market, including small-cap stocks and cyclical sectors, have outperformed in recent weeks.

From a regional perspective, the MSCI Emerging markets (+6.3%) outperformed the MSCI Developed markets (+3.4%). Fixed income also recorded positive returns overall, with global bonds rallying 0.7% over the month. Commodity prices reversed some of their year-to-date losses, with the broad Bloomberg Commodity Index rising 6.3% over July (see chart #9).

Picture1-Aug-07-2023-02-43-12-0050-PM
 
Source:  JP Morgan 


Chart #2  — 

A very long positive streak for the Dow Jones

The Dow Jones (DJIA) delivered 13 consecutive positive days in July. This is the longest positive streak for the index since 1987 . 

Picture2-Aug-07-2023-02-44-46-7140-PM

Source: www.zerohedge.com


Chart #3  — 

So far, 2023 has been a mirror image of 2022  

2023 has been so far the exact opposite of 2022 in terms of assets returns. This is best illustrated by the performance of the Nasdaq 100 and the “magnificent 7” in particular. 

Picture3-Aug-07-2023-02-46-04-7197-PM

Source: Charlie Bilello 


Chart #4 — 

The US economy continues to surprise on the upside


Part of the strong performance of the equity market over the recent months can be explained by the resilience of the global economy and the US in particular. While manufacturing sector continues to struggle, services remain strong. We note that the Citi US Economic Surprise Index is at the highest level since early 2021.

Picture4-Aug-07-2023-02-47-46-0590-PM

Source:  Bloomberg


Chart #5 — 

Inflation continues to cool down   


Global inflation continues to move lower. In the US, June inflation numbers showed signs of cooling faster than expected with the Fed’s favourite gauge of inflation, the PCE index, slowing to 3% in June, down from 3.8% in May and the lowest monthly change in more than 2 years. The same trend can be observed in most countries. 

Picture5-Aug-07-2023-02-49-57-6415-PM

Source:  Charlie Bilello


Chart  #6 — 

A “dovish” hike?

In light of the cooling down of inflation, markets have been progressively anticipating the end of the US interest rate hiking cycle. At the July FOMC, the FED raised interest rates by a quarter point (as expected) to the highest level in 22 years and left the door open for additional increases as officials fine-tune their effort to further quell inflation. But there were some dovish statements as well. Indeed, the FED said they are taking a "meeting by meeting" approach to future interest rate policy. For the 1st time in this cycle, Fed rates match headline CPI but also tops Personal Consumption Expenditure (PCE ) index. This fuels speculation that the Fed is nearly done.

Picture6-Aug-07-2023-02-51-39-4199-PM

Source:  Bloomberg


Chart #7 — 

Strong corporate earnings but no love for beats so far  

 More than 50% of S&P 500 companies have now reported their Q2 earnings. Of these companies, 80% have reported actual EPS above estimates, which is above the 5-year average of 77% and above the 10-year average of 73%. However, we note that stocks that have beaten EPS estimates this season aren’t going up like they normally have over the last 10 years. They have averaged a one-day gain in share price of just 0.27% in reaction to the beat. Over the last ten years, an earnings beat has resulted in a much bigger one-day gain of 1.58%. At the same time, stocks that have missed EPS estimates this season have averaged a one-day drop in share price of 3.54%. That's worse than the normal drop of 3.34% across all earnings misses over the last ten years.

Picture7-Aug-07-2023-02-56-38-5298-PM

Source:  Bespoke


Chart #8 — 

Bonds and equities correlation spikes   


US Treasuries haven’t been this ineffective as a stock hedge since the 1990s. The one-month correlation between the two assets is now at its highest reading since 1996.


Picture8-2

Source:  Bloomberg


Chart #9 — 

Commodities posted a very strong July


The Goldman Sachs Commodity Index (GSCI) is up over 10% in July, driven mostly by oil which had its best month since January 2022. WTI Oil rose from a low of $67 in late June to way above $80 in July on better than expected global growth, China stimulus talk and supply concerns. Meanwhile, Russia’s cancellation of the Black Sea grain export deal contributed to price rises in certain agricultural commodities. A weaker USD was also beneficial to commodities more broadly.

Picture9-1

Source: Bloomberg


Chart #10 — 

An “X” story   


Twitter owner Elon Musk officially changed the company’s famous bird logo to an “X” on July 23rd as part of the rebranding strategy. Musk, who acquired the platform for $44 billion late last year, wrote in a post that the company would soon “bid adieu to the twitter brand and, gradually, all the birds.”

As of now, the domain X.com directs users to Twitter’s homepage, though Twitter.com also remains live. This is part of his plan to create an “everything app” that would incorporate shopping, banking, and other features. Elon Musk founded the first http://X.com in 1999 (it became PayPal) then SpaceX and now xAI. 

Picture10-3


Disclaimer

This marketing document has been issued by Bank Syz Ltd. It is not intended for distribution to, publication, provision or use by individuals or legal entities that are citizens of or reside in a state, country or jurisdiction in which applicable laws and regulations prohibit its distribution, publication, provision or use. It is not directed to any person or entity to whom it would be illegal to send such marketing material. This document is intended for informational purposes only and should not be construed as an offer, solicitation or recommendation for the subscription, purchase, sale or safekeeping of any security or financial instrument or for the engagement in any other transaction, as the provision of any investment advice or service, or as a contractual document. Nothing in this document constitutes an investment, legal, tax or accounting advice or a representation that any investment or strategy is suitable or appropriate for an investor's particular and individual circumstances, nor does it constitute a personalized investment advice for any investor. This document reflects the information, opinions and comments of Bank Syz Ltd. as of the date of its publication, which are subject to change without notice. The opinions and comments of the authors in this document reflect their current views and may not coincide with those of other Syz Group entities or third parties, which may have reached different conclusions. The market valuations, terms and calculations contained herein are estimates only. The information provided comes from sources deemed reliable, but Bank Syz Ltd. does not guarantee its completeness, accuracy, reliability and actuality. Past performance gives no indication of nor guarantees current or future results. Bank Syz Ltd. accepts no liability for any loss arising from the use of this document.

Read More

Straight from the Desk

Syz the moment

Live feeds, charts, breaking stories, all day long.

Thinking out loud

Sign up for our weekly email highlighting the most popular posts.

Follow us

Thinking out loud

Investing with intelligence

Our latest research, commentary and market outlooks