
Charles-Henry Monchau, CFA, CMT, CAIA

Chief Investment Officer

Chart #1 — 

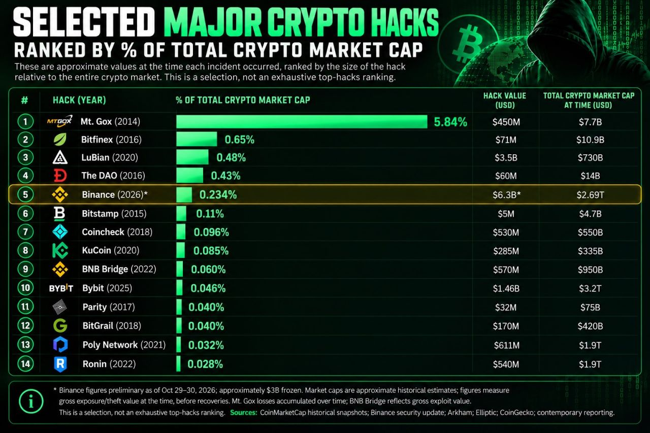
Crypto giant Binance hit by $6.3bn hack suspected to be largest in history

Binance has suffered a hack with estimated losses of up to $6.3bn, which would make it the largest crypto theft on record. Context, however, matters.

The breach at Binance is estimated at $6.3bn, of which about $3bn has been frozen so far, and the exchange has pledged to cover all losses. This is a serious incident, and its final financial cost is still being assessed.

The headline figure, however, tells only part of the story. Based on the estimates in the chart below, the stolen amount equals roughly 0.23% of total crypto market capitalisation. By comparison:

• Mt. Gox, 2014: 5.84%

• Bitfinex, 2016: 0.65%

• The DAO, 2016: 0.43%

Because the crypto market is far larger today, this incident ranks below several earlier breaches in relative terms. None of this excuses the security failure. Market capitalisation, however, is no measure of an exchange’s capacity to absorb losses. It does help put the incident in perspective, distinguishing a major operational failure from claims that the entire industry is collapsing. The security concerns stand, but they should be weighed against the size of the market.
Source: Bitcorn
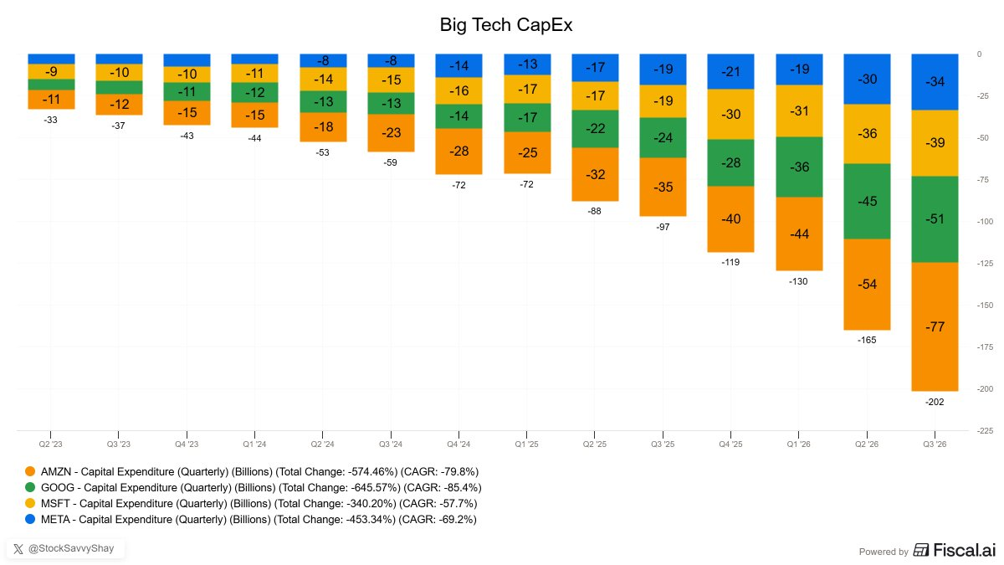
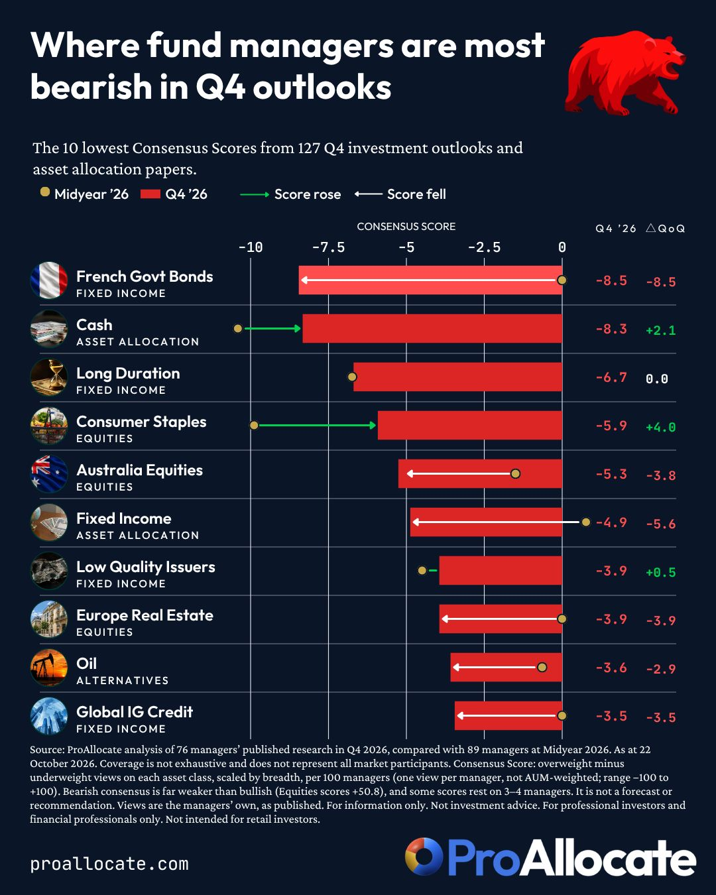
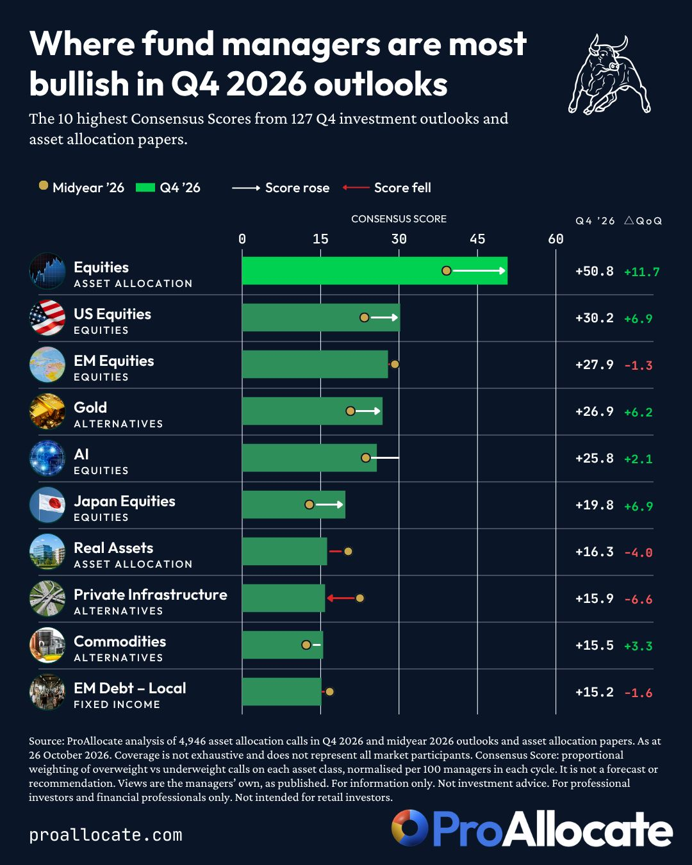
Chart #2 — 

The Big 4 have now revealed their quarterly CapEx spending with a combined total surpassing $200bn 

• Amazon: about $77bn

• Alphabet: about $51bn

• Microsoft: about $39bn

• Meta: about $34bn

Source: Fiscal.ai


Chart #3 — 

Where are asset managers most bearish in Q4 2026 investment outlooks? 

ProAllocate reviewed more than 120 outlooks and asset allocation papers from 76 firms, covering views on over 450 sub-asset classes, factors, themes and markets.

The most widely shared underweight was French government bonds (OATs), with managers pointing to France’s public finances and political situation, which have pushed the spread between French and German 10-year yields to its widest level since the euro debt crisis.

Within equities, managers are cautious on Consumer Staples, European Listed Real Estate and Australian equities. Fixed income is also broadly out of favour, particularly Long Duration, Low Quality Issuers and Global Investment Grade Credit, which all received low scores.

Among alternatives, oil is unpopular following this year’s sharp price swings, while cash remains an underweight despite an improvement in sentiment since last quarter.

So where is the money going instead? Chart #4 has the answer.

Source: Stephen White


Chart #4 — 

Where are asset managers most bullish in Q4 2026 investment outlooks? 

The flip side of the same ProAllocate review: if managers are shunning bonds, where are they putting their money?

The clearest consensus call is equities. Of the 66 firms expressing a view, 52 were overweight, 11 were neutral and just three were underweight. Most point to double-digit earnings growth, resilient nominal growth and AI investment broadening beyond Big Tech. The more cautious minority highlights the risks from rate hikes, higher real yields and oil prices.

Looking across tactical asset allocation horizons of 6–12 months, managers also favour the US, emerging markets, Japan and AI-related stocks, albeit selectively.

In fixed income, local-currency emerging market debt is the only position to make the top 10. Among alternatives, firms remain positive on gold, real assets, private infrastructure and commodities more broadly.

Source: Stephen White


Chart #5 — 

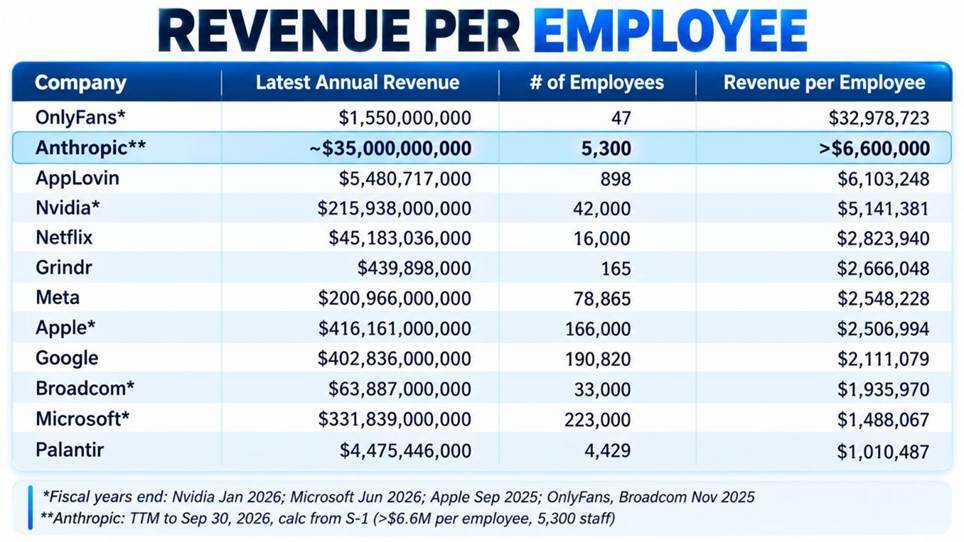
Anthropic is generating an extraordinary $6.6mn in revenue per employee

This places the AI company ahead of Nvidia, Meta, Apple and Google, and behind only OnlyFans among the companies listed:

OnlyFans: $33.0mn

Anthropic: $6.6mn

AppLovin: $6.1mn

Nvidia: $5.1mn

Netflix: $2.8mn

Grindr: $2.7mn

Meta: $2.5mn

Apple: $2.5mn

Google: $2.1mn

One important caveat applies. Revenue per employee measures how much revenue a company generates relative to its workforce but reveals little about its profitability or infrastructure costs.

Even so, the figure shows how rapidly Anthropic has grown. Does this offer a preview of what AI-native companies can achieve with leaner teams?

Source: Trung Phan


Chart #6 —

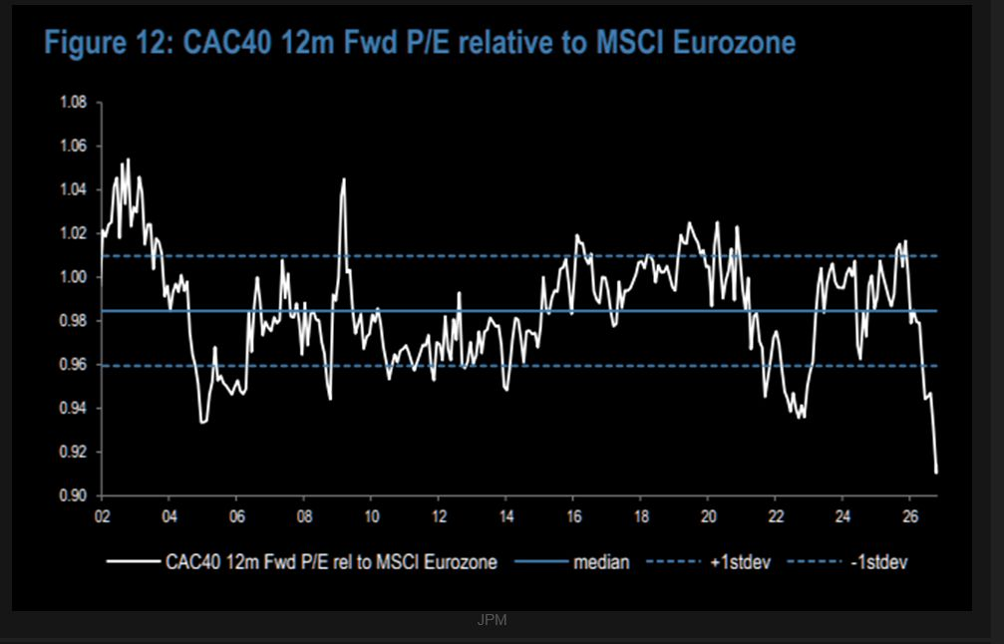
Are French stocks too cheap to ignore?

French equities are deeply out of favour, and the valuation gap has reached historic levels. After more than three years of underperformance, the CAC 40 trades at its lowest valuation relative to the Eurozone on record, according to JPMorgan.

Investors have been pulling back from French assets, and sentiment remains very depressed.

For contrarian investors, the attraction is obvious. The harder question is whether the current discount represents a real opportunity or simply prices in the risks ahead.

Source: JPM, TME


Chart #7 — 

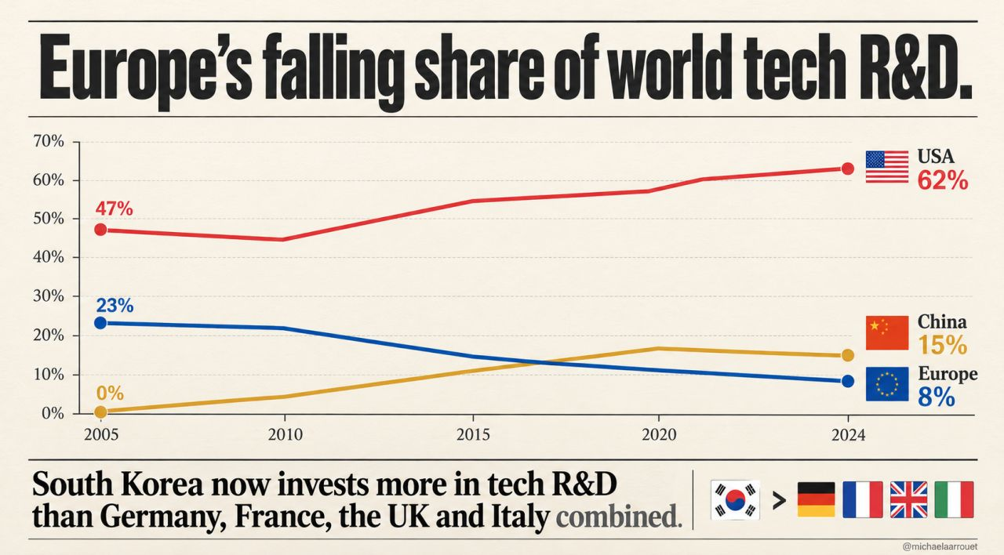
Europe’s falling share of world tech R&D 

Europe aims to regulate the future. The question is who will build it.

Europe’s share of global technology R&D:

  • 2005: 23%
  • Today: 8%

Today, by contrast:

  • US: 62%
  • China: 15%
  • South Korea now invests more than Germany, France, the UK and Italy combined.

Europe does not lack talent, universities or capital. What it increasingly lacks is an environment that rewards turning ideas into global companies. Each additional layer of compliance absorbs resources, every obstacle to scaling pushes opportunities abroad, and every cut to the rewards for risk-taking erodes the incentive to innovate.

Regulation serves a purpose, as does redistribution, but neither can replace wealth creation. Europe needs simpler rules, stronger investment incentives and greater ambition to build. A continent cannot fund tomorrow’s prosperity by regulating yesterday’s success. The choice is clear, build the next generation of global champions, or become an open-air museum for those who do.


Source: Michel A.Arouet


Disclaimer

This marketing document has been issued by Bank Syz Ltd. It is not intended for distribution to, publication, provision or use by individuals or legal entities that are citizens of or reside in a state, country or jurisdiction in which applicable laws and regulations prohibit its distribution, publication, provision or use. It is not directed to any person or entity to whom it would be illegal to send such marketing material. This document is intended for informational purposes only and should not be construed as an offer, solicitation or recommendation for the subscription, purchase, sale or safekeeping of any security or financial instrument or for the engagement in any other transaction, as the provision of any investment advice or service, or as a contractual document. Nothing in this document constitutes an investment, legal, tax or accounting advice or a representation that any investment or strategy is suitable or appropriate for an investor's particular and individual circumstances, nor does it constitute a personalized investment advice for any investor. This document reflects the information, opinions and comments of Bank Syz Ltd. as of the date of its publication, which are subject to change without notice. The opinions and comments of the authors in this document reflect their current views and may not coincide with those of other Syz Group entities or third parties, which may have reached different conclusions. The market valuations, terms and calculations contained herein are estimates only. The information provided comes from sources deemed reliable, but Bank Syz Ltd. does not guarantee its completeness, accuracy, reliability and actuality. Past performance gives no indication of nor guarantees current or future results. Bank Syz Ltd. accepts no liability for any loss arising from the use of this document.

Read More

Straight from the Desk

Syz the moment

Live feeds, charts, breaking stories, all day long.

Thinking out loud

Sign up for our weekly email highlighting the most popular posts.

Follow us

Thinking out loud

Investing with intelligence

Our latest research, commentary and market outlooks