Charles-Henry Monchau

Chief Investment Officer

Chart #1 — 

The bond market is fighting the US Treasury 

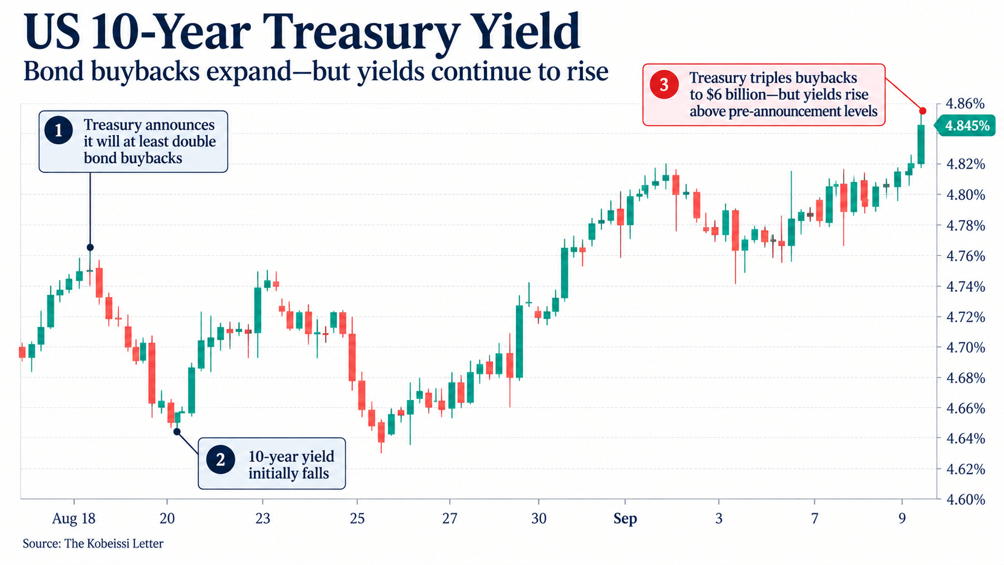
On Wednesday, the US Treasury announced that it would triple its long-term bond buybacks to $6 billion, yet yields still moved higher on the news.

In other words, the Treasury has gone from doubling, to “at least doubling”, to tripling its long-term buybacks, and yields keep climbing.

The 10-year Treasury yield now stands above 4.85% for the first time since November 2023, up 15 basis points from its pre-announcement level.

With the war in Iran ongoing, the bond market is openly pushing back against the Treasury: the 10-year yield is now up nearly 100 basis points since the conflict began.

Source: The Kobeissi Letter 


Chart #2 — 

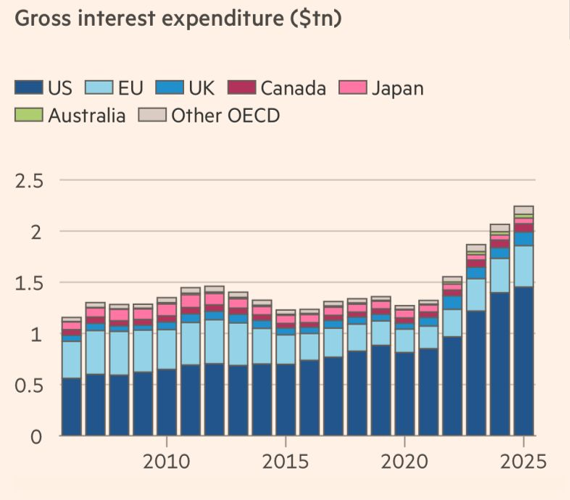
Interest on government debt in the OECD now exceeds $2 trillion per year  

If one thing about this Financial Times chart is almost certain, it is that those bars will keep rising. 


Source:  Mo El Erian, Financial Times


Chart #3 — 

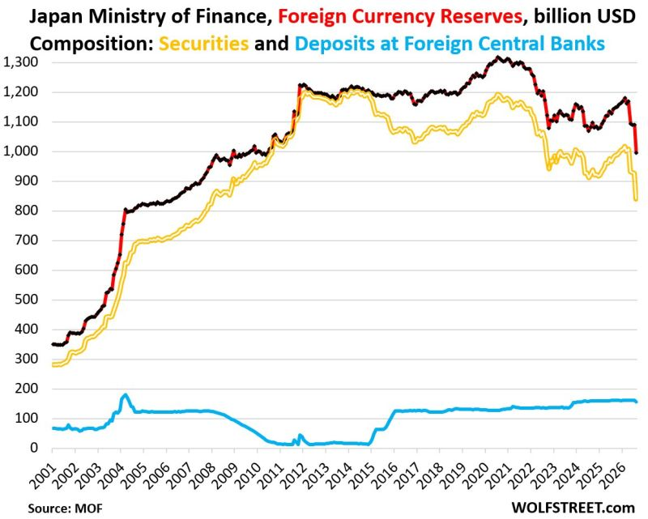
Japan's currency defense just triggered the largest monthly drop in its FX reserves EVER

Japan’s foreign exchange reserves fell by $94.6 billion (-8.7%) in August to $995 billion, the largest monthly decline on record, as the Ministry of Finance intervened to support the yen.

Over the four months from May to August, across several rounds of intervention, reserves have declined by a cumulative $174 billion, or -14.9%.

The bulk of the decline came from securities holdings, primarily US Treasuries, which fell by $87.8 billion in August alone to $840 billion, while foreign currency deposits dropped by a more modest $6.9 billion to $155 billion. Little wonder that Washington is taking a closer interest in Japan’s currency policy. 


Source: Global Markets Investor @GlobalMktObserv, Wolfstreet 


Chart #4 — 

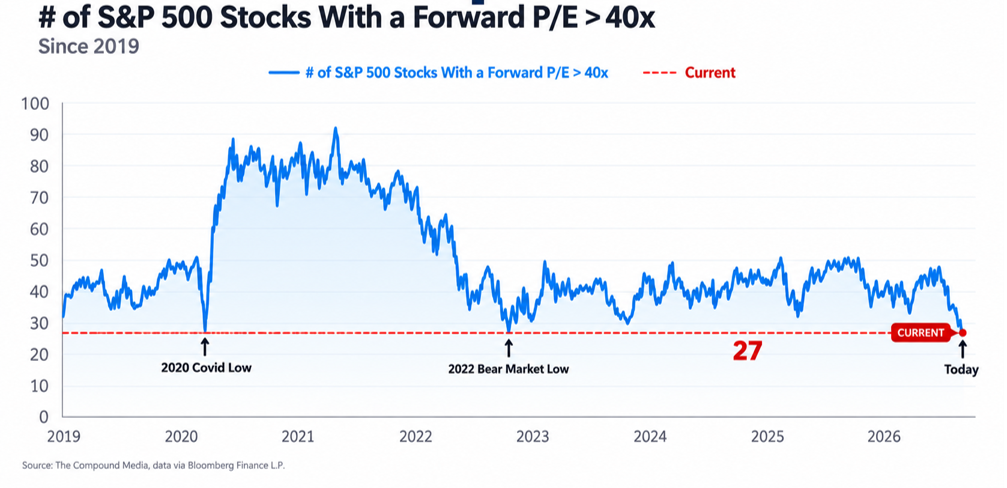
Where's the speculation?  

The number of S&P 500 stocks trading on a forward P/E above 40x has dropped to levels last seen at the Covid low and the 2022 bear-market trough.


Source: The Chart Report, The Compound media


Chart #5 — 

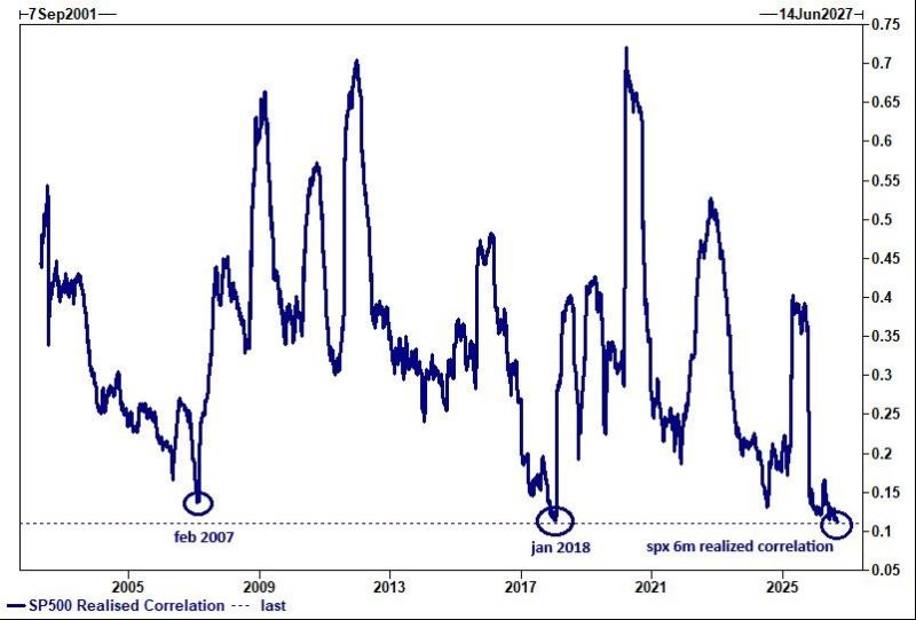
The S&P 500 looks calm. Beneath the surface, it isn’t


Six-month realized correlation has dropped to just 0.11, a level reached only twice in the past 25 years.

Low correlation lets traders sell index volatility, buy single-stock volatility and capture the spread. When stocks abruptly start moving in tandem, however, that trade can unwind across the market all at once.

March offered a reminder: implied correlation surged from around 15 to 40 in a matter of weeks, while JPMorgan’s dispersion index posted its worst month since 2011.

The deeper concern is concentration: Nvidia’s four largest customers account for 44% of its revenue, and those same mega-caps dominate the index, yet their daily correlations remain unusually low.

This is not necessarily a crash signal. It is, however, a sign of fragility.

A portfolio may hold many stocks yet offer far less genuine diversification than its number of positions implies.

The index looks calm not because nothing is moving, but because stocks are moving in opposite directions, and that can reverse very quickly.

Source: Thierry from arvy @ThierryBorgeat 


Chart #6 —

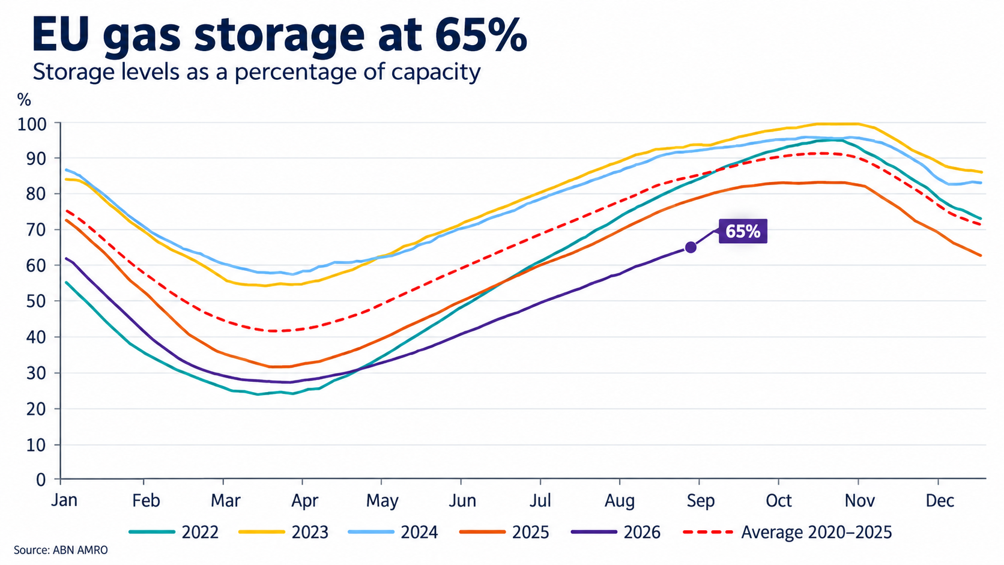
Natural Gas is flashing red as the European buffer is depleted

Europe is heading into the 2026/27 heating season in its most vulnerable position since 2011. EU gas storage stands at only 65%, compared with a five-year average of 82% and well short of the EU’s 90% target.

This is more than a weather-driven squeeze: Europe enters the winter with a structural supply problem already in place. Disruption in the Strait of Hormuz has effectively taken Qatari LNG off the market, with exports down by roughly 96%.

Source:  ABN Amro, TME


Chart #7 — 

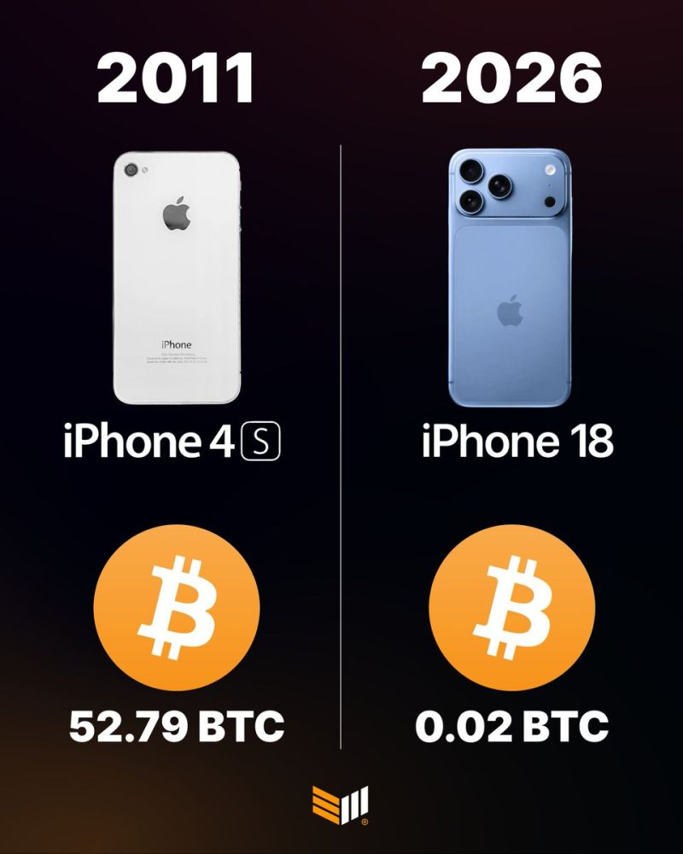
iPhone price in bitcoin over the years

When the iPhone 4 was launched in 2010, buying one cost 52.79 BTC.

Today, the new iPhone 18 costs just 0.02 BTC. 


Source: Bitcoin Magazine @BitcoinMagazine


Disclaimer

This marketing document has been issued by Bank Syz Ltd. It is not intended for distribution to, publication, provision or use by individuals or legal entities that are citizens of or reside in a state, country or jurisdiction in which applicable laws and regulations prohibit its distribution, publication, provision or use. It is not directed to any person or entity to whom it would be illegal to send such marketing material. This document is intended for informational purposes only and should not be construed as an offer, solicitation or recommendation for the subscription, purchase, sale or safekeeping of any security or financial instrument or for the engagement in any other transaction, as the provision of any investment advice or service, or as a contractual document. Nothing in this document constitutes an investment, legal, tax or accounting advice or a representation that any investment or strategy is suitable or appropriate for an investor's particular and individual circumstances, nor does it constitute a personalized investment advice for any investor. This document reflects the information, opinions and comments of Bank Syz Ltd. as of the date of its publication, which are subject to change without notice. The opinions and comments of the authors in this document reflect their current views and may not coincide with those of other Syz Group entities or third parties, which may have reached different conclusions. The market valuations, terms and calculations contained herein are estimates only. The information provided comes from sources deemed reliable, but Bank Syz Ltd. does not guarantee its completeness, accuracy, reliability and actuality. Past performance gives no indication of nor guarantees current or future results. Bank Syz Ltd. accepts no liability for any loss arising from the use of this document.

Read More

Straight from the Desk

Syz the moment

Live feeds, charts, breaking stories, all day long.

Thinking out loud

Sign up for our weekly email highlighting the most popular posts.

Follow us

Thinking out loud

Investing with intelligence

Our latest research, commentary and market outlooks