Charles-Henry Monchau

Chief Investment Officer

pdf

Chart #1 — 

Equity and bond markets remain under pressure 

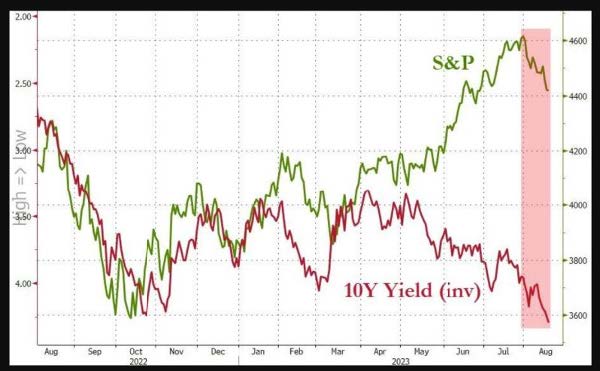
Equities fell for the third week in a row, as investor sentiment appeared to be affected by the sharp rise in long-term bond yields and fears of a sharp slowdown in China. The yield 
on 10-year Treasury bonds flirted with 4.30% last week, its highest level since October 2007.

In terms of overall performance (change in price + coupon), 10-year Treasuries are now down 1% in 2023 and on course for their third consecutive year of negative performance. Based on data going back to 1928, this has never happened before. As the chart below shows, a change of regime seems to have taken place since July; unlike in the first half of the year, the correlation between equity and bond markets is now positive. 

pic 1-Aug-21-2023-03-21-16-1398-PM

Source: Bloomberg


Chart #2 — 

Chinese property developers' bonds test
lows

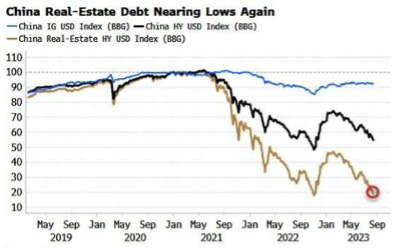
China is currently facing a whole series of problems: a crisis of confidence, problems linked to the shadow banking system, the inability of the private sector to stimulate growth, record unemployment among China's young people and, above all, a crisis in the property sector. The long-term fundamentals of the housing market have changed: China's population has probably peaked; urbanisation is slowing and the rate of home ownership is already very high. This means that property demand and construction will remain well below the peaks reached in 2020-2021, even if they recover from their lows. In the meantime, the sector remains under intense pressure and threatens China's economic and financial stability. 

Country Garden, China's largest property developer, is facing insolvency, with billions of dollars in losses and $200 billion in unpaid bills. Meanwhile, Evergrande last week filed for Chapter 15 bankruptcy protection in a Manhattan court. In July, Evergrande posted a combined loss of $81 billion over the past two years. Complicating China's property problem is the fact that China's state-owned property developers are also in deep trouble, reducing their ability to support the sector by taking over unfinished projects from the private sector. As a result, the real estate index for Investment Grade and High Yield debt in the Chinese real estate sector is close to historic lows.

pic 2-Aug-21-2023-03-22-46-3513-PM

Source:  Bloomberg


Chart #3 — 

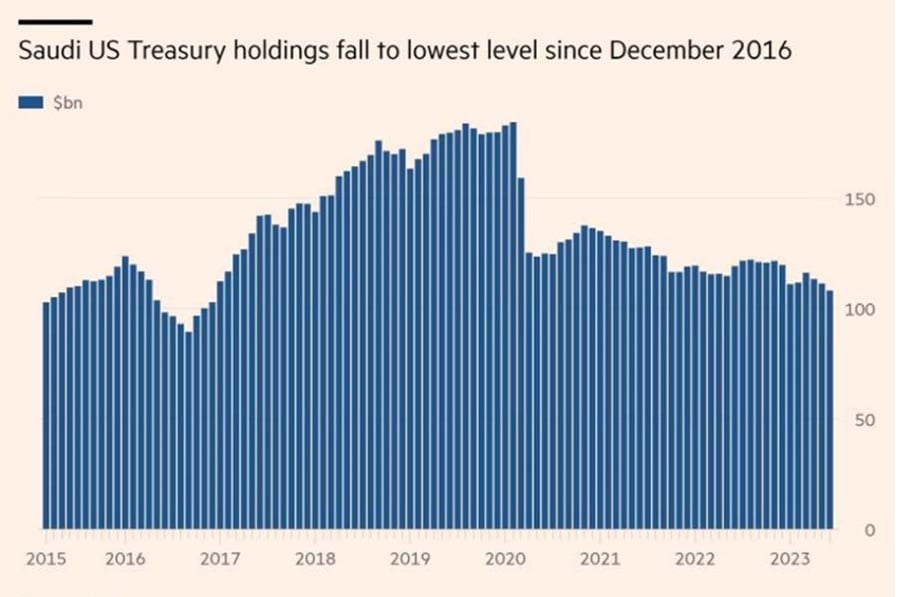
US Treasury holdings by China and Saudi Arabia keep declining 

Unlike China, where sovereign debt yields are falling steadily (due to the risk of deflation), US Treasury bond yields are rising. This is another stress factor for the equity markets. This is a delicate time for US sovereign debt, which is facing multiple headwinds: economic strength (the Atlanta Fed's real-time GDP growth forecasts are close to 5.8% for the third quarter), rising energy prices, the Fed's quantitative tightening and, finally, weakening demand from historic buyers of US Treasury bonds. Indeed, China's holdings of US Treasuries have just hit their lowest level in 14 years, falling below $850 billion; Saudi Arabia's stock of US Treasuries has fallen to its lowest level in over six years (to less than $100 billion), while Japanese investors - the largest foreign holders of US Treasuries - are now less interested in US bonds due to the rise in yields on long-term Japanese bonds following the Bank of Japan's adjustment of monetary policy.

This drop in demand is very bad news for Uncle Sam. US interest costs have risen by around 50% over the past year, to almost $1,000 billion on an annual basis.It also comes at a time when the supply of US Treasury securities is very high. As the budget deficit explodes, the US Treasury will sell $1 trillion of debt this quarter, the second highest amount in history (only the $2.753 trillion linked to Covid in the second quarter of 2020 exceeds it) - and a further $852 billion is expected in the fourth quarter.Total US debt levels are expected to rise from 98% of GDP in 2023 to 118% of GDP in 2033. By 2053, the US debt-to-GDP ratio is expected to reach an alarming 195% (CBO). Fitch's downgrade, while not immediately catastrophic, is a warning of the potential repercussions of rising debt and lack of fiscal discipline. While yields are looking increasingly attractive on the intermediate and long ends of the US yield curve, investors are well aware of the weak fundamentals and may demand a higher premium to invest in Treasuries in the future.

pic 3-Aug-21-2023-03-26-52-9971-PM

Source: FT


Chart #4 — 

Rising mortgage rates freeze transactions on the US real estate market 


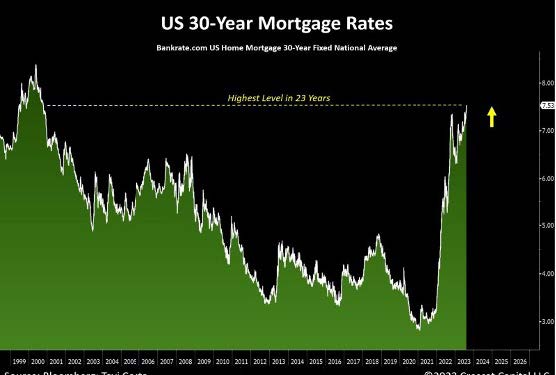
Average mortgage rates in the US have just risen above 7.5% for the first time in 23 years. There are a number of reasons why US property prices have not collapsed: 1) buyers cannot afford to borrow at current rates; 2) sellers are refusing to sell their properties because a new purchase would involve a mortgage rate that is significantly higher than the rate at which they borrowed previously. This situation is  depressing the number of property transactions. 

pic 4-Aug-21-2023-03-28-55-0778-PM

Source: Crescat Capital, Bloomberg 


Chart #5 — 

Is it a proof that Russia is losing the war?    


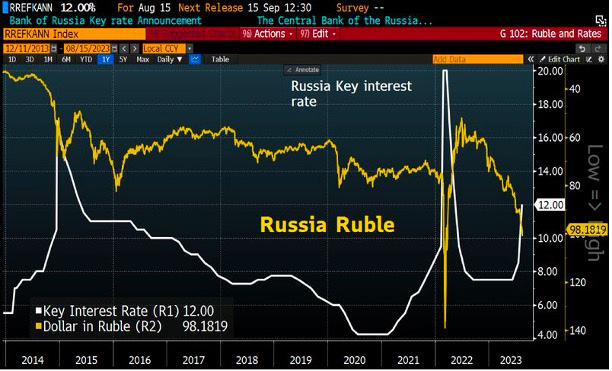
The rouble fell below 100 to the US dollar on Monday, approaching its lowest level for 17 months.  President Vladimir Putin's economic adviser blamed this rapid depreciation on an insufficiently restrictive monetary policy. The rouble has lost around 27% against the greenback since the start of the year. It has also lost 23% against the Chinese yuan, which Russia favours for its trade as it seeks to rid itself of Western currencies.

The Central Bank of Russia has blamed the contraction in the country's trade balance, with Russia's current account surplus falling 85% year-on-year between January and July. The weakening rouble threatens to fuel an inflationary spiral in an economy paralysed by Western sanctions. Earlier this week, the Russian central bank raised its key interest rate from 8.5% to 12% at an emergency meeting called after the collapse of the rouble.

pic 5-Aug-21-2023-03-30-08-2168-PM

Source: HolgerZ, Bloomberg, DJ, CNBC   


Chart #6 — 

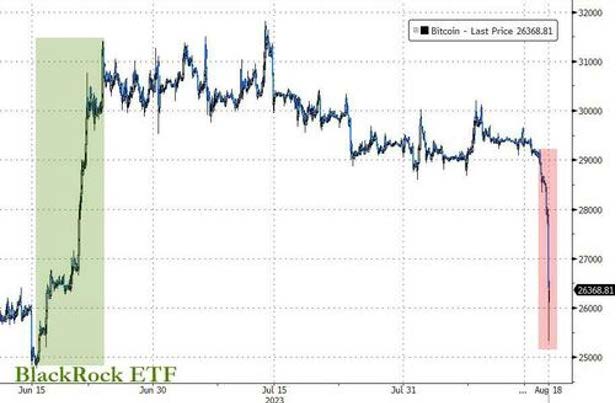
Bitcoin lost $2,000 in 10 minutes 


After falling from $29,000 on Wednesday evening to $27.5,000 during the day on Thursday, bitcoin collapsed by $2,000 in just 10 minutes on Thursday night to reach a low of $25,314. The cause: massive sell orders that quickly eliminated all the stoplosses that were in place.

Although the technical or fundamental catalyst behind this 'flash-crash' has yet to be established, the publication of a tweet claiming that Elon Musk's SpaceX had sold all the BTC it had previously acquired ($373 million) seems to coincide with this lightning fall, which took bitcoin's market capitalisation below the $500 billion mark for the first time since 16 June. Whatever the reason, bitcoin's entire rise since the mini-euphoria linked to Blackrock's ETF in mid-June has been wiped out.

pic 6-Aug-21-2023-03-31-57-0548-PM

Source:  www.zerohedge.com, Bloomberg


Chart #7 — 

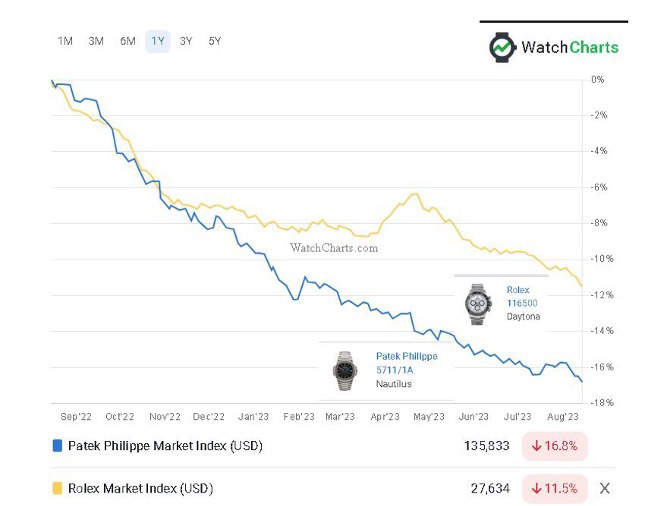
A sharp fall in the price of second-hand luxury watches   


The Watchcharts indices for Rolex and Patek second-hand watches have fallen by -11.5% and -16.8% respectively over the past 12 months.

This is an interesting smoothed time series for the global economy, as it is independent of manipulation and less subject to day-to-day changes in sentiment.

pic 7-Aug-21-2023-03-33-38-8167-PM

Source: www.watchcharts.com

Disclaimer

This marketing document has been issued by Bank Syz Ltd. It is not intended for distribution to, publication, provision or use by individuals or legal entities that are citizens of or reside in a state, country or jurisdiction in which applicable laws and regulations prohibit its distribution, publication, provision or use. It is not directed to any person or entity to whom it would be illegal to send such marketing material. This document is intended for informational purposes only and should not be construed as an offer, solicitation or recommendation for the subscription, purchase, sale or safekeeping of any security or financial instrument or for the engagement in any other transaction, as the provision of any investment advice or service, or as a contractual document. Nothing in this document constitutes an investment, legal, tax or accounting advice or a representation that any investment or strategy is suitable or appropriate for an investor's particular and individual circumstances, nor does it constitute a personalized investment advice for any investor. This document reflects the information, opinions and comments of Bank Syz Ltd. as of the date of its publication, which are subject to change without notice. The opinions and comments of the authors in this document reflect their current views and may not coincide with those of other Syz Group entities or third parties, which may have reached different conclusions. The market valuations, terms and calculations contained herein are estimates only. The information provided comes from sources deemed reliable, but Bank Syz Ltd. does not guarantee its completeness, accuracy, reliability and actuality. Past performance gives no indication of nor guarantees current or future results. Bank Syz Ltd. accepts no liability for any loss arising from the use of this document.
Read More

Straight from the Desk

Syz the moment

Live feeds, charts, breaking stories, all day long.

Thinking out loud

Sign up for our weekly email highlighting the most popular posts.

Follow us

Thinking out loud

Investing with intelligence

Our latest research, commentary and market outlooks