Charles-Henry Monchau

Chief Investment Officer

Chart #1 — 

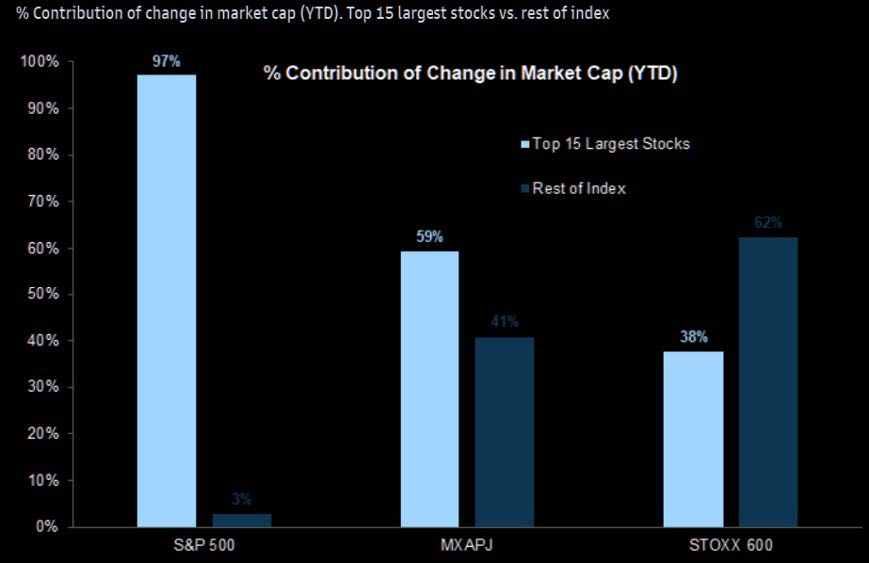
The S&P 500 is up nearly 8% since the beginning of the year, but only a few stocks are contributing to this performance 

Despite a rebound on Friday (thanks to Apple's results - see chart #2), the S&P 500 index ended the week slightly lower following comments from Fed Chairman Jerome Powell, who suggested that a "pivot" to a rate cut may not happen as quickly as the market hopes (see chart #6). Concerns about the U.S. debt ceiling may also have weighed on sentiment.

Following this slight pullback, the S&P 500 is now up 7.7% year-to-date. It should be noted that the increase in the leading U.S. stock index is based on only a small number of stocks. Indeed, 97% of the S&P 500's year-to-date performance can be attributed to just 15 stocks. This is a rare level of performance concentration and does not necessarily bode well for the future. 

chart 1

Source: Datastream, TME


Chart #2 — 

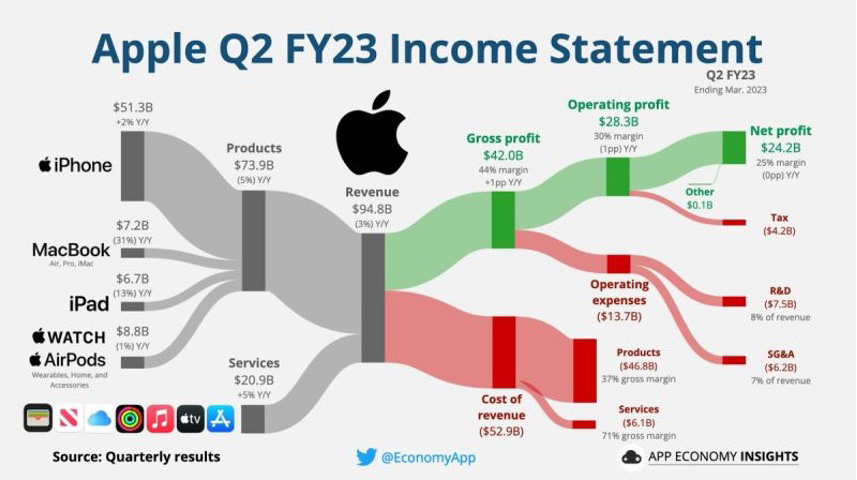
Apple reports quarterly results ahead of analysts' consensus expectations


It was the most anticipated earnings release of the week. Apple reported its first quarter results on Thursday night after the market closed. It was a strong quarter, during which Apple broke a number of records, allowing executives to announce a massive $90 billion share buyback program.

Revenue reached $94.8 billion, $2 billion more than expected, but still a 2% decline from Q1 2022. Services grew by 5% year-on-year ($73.9 billion in revenue) while products declined by 5% ($20.9 billion). Operating margins were down slightly by 1% to 30%. Earnings per share were $1.52, 9 cents better than expected. 


chart 2

Source: App Economy Insights


Chart #3 — 

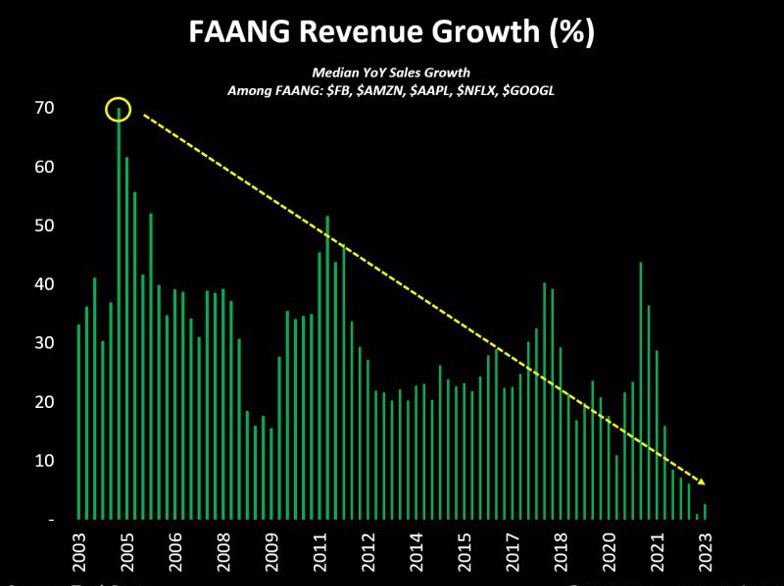
FAANGs' revenue growth is normalizing 

 All FAANGs stocks have now reported their results. It is clear that the median revenue growth continues to weaken. Note that this data is calculated in nominal terms. As the recent price increase has contributed significantly to revenue growth, the real growth rate is probably negative. Because of their size, these mega-cap companies are no longer able to grow their revenues at the rate they did a few years ago.

However, their valuation multiple (P/E all above 25x) corresponds to the price paid for high-growth stocks. Given their very high weighting in the indexes, these stocks represent a significant downside risk for the entire market. 

chart 3


Source: Crescat Capital, Bloomberg


Chart #4 — 

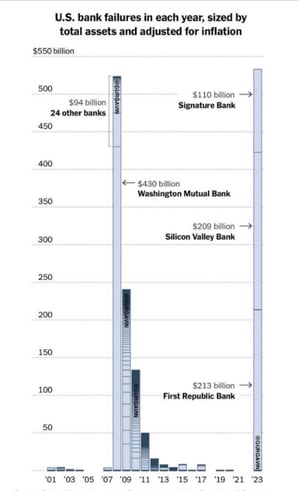
The amount of bank failures in the United States in 2023 is already higher than in 2008 


Over the previous weekend, U.S. regulators took control of California-based First Republic Bank, which, like Silicon Valley Bank and Signature Bank, had faced large deposit outflows. JPMorgan Chase acquired most of the failed bank's assets, and deposits not covered by federal insurance did not suffer losses. The regional bank subsector of the S&P 500 Index experienced significant volatility during the week, reflecting concerns about the risk of further bank failures and the credit pressures that could arise as the economy slows and unemployment rises.

First Republic Bank was the second largest bank failure in U.S. history. Only Washington Mutual was larger. Cumulatively, the assets that were held by the three banks that failed this year are larger than the 25 banks that collapsed in 2008 even when adjusted for inflation.

chart 4

Source: FDIC 


Chart #5 — 

U.S. unemployment rate at its lowest since 1969 

Friday's employment report was certainly the most anticipated figure of the week. This report shows that the U.S. economy continues to create a lot of jobs and that wages continue to rise; a development that is certainly not to the liking of the Federal Reserve. Indeed, the U.S. economy added 253,000 jobs in April, compared to an expected 185,000, showing the resilience of the labor market. The unemployment rate fell to a record low of 3.4%, while monthly wage gains accelerated at the fastest pace since July.

chart 5

Source: Bloomberg


Chart #6 — 

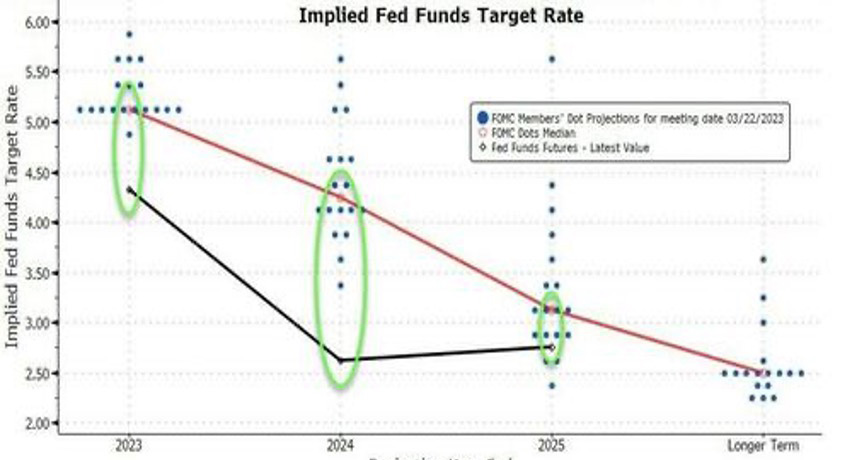
A strong dichotomy between the market and the Fed on US interest rate expectations  


The much anticipated May FOMC meeting took place on Wednesday. The Fed raised rates by 25 basis points, which was widely anticipated by the market. In addition, it did not signal any further rate hikes for the next few months, suggesting that this hike could be the last. However, the statement is slightly more hawkish than expected, as the Fed indicated that it would take into account "the cumulative tightening of monetary policy, the lags in which monetary policy is affecting economic activity and inflation, and economic and financial developments" to "determine the extent to which further tightening of monetary policy may be appropriate."


Note that the market remains overwhelmingly more dovish than the Fed's expectations. Indeed, investors estimate a 38% chance of a rate cut as early as July, which is not the case for the Fed. Market forecasts for the end of 2023, 2024 and 2025 are also betting on lower rates than what the Fed is projecting.

chart 7

Source: Bloomberg, www.zerohedge.com 


Chart #7 — 

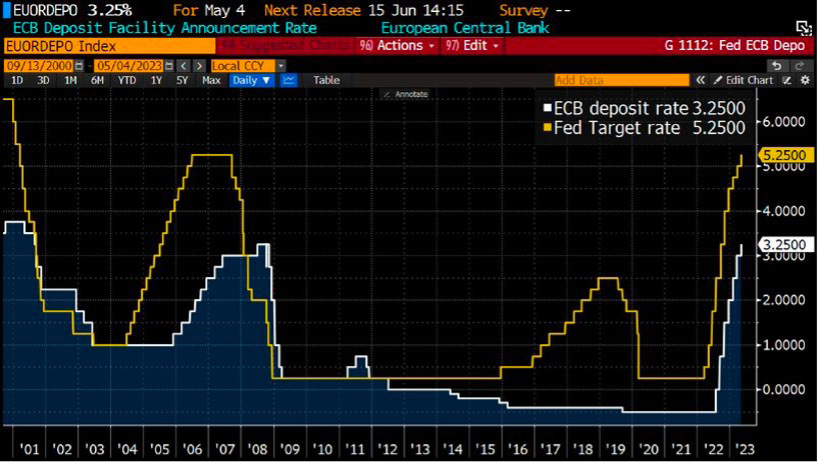
ECB raises rates by 25 basis points


As expected, the ECB slowed the pace of its rate hikes, announcing a 25 basis point increase, bringing the key rate to 3.25%. For Christine Lagarde and the ECB members, inflation remains the main concern as "the inflation outlook continues to be too high over time". The ECB underlines its dependence on European macroeconomic data with this key phrase from Lagarde: "We are not dependent on the Fed". Future decisions will continue to be based on their assessment of the inflation outlook in light of new economic and financial data, underlying inflation dynamics and the strength of monetary policy transmission.

chart 8Source: Bloomberg

Disclaimer

This marketing document has been issued by Bank Syz Ltd. It is not intended for distribution to, publication, provision or use by individuals or legal entities that are citizens of or reside in a state, country or jurisdiction in which applicable laws and regulations prohibit its distribution, publication, provision or use. It is not directed to any person or entity to whom it would be illegal to send such marketing material. This document is intended for informational purposes only and should not be construed as an offer, solicitation or recommendation for the subscription, purchase, sale or safekeeping of any security or financial instrument or for the engagement in any other transaction, as the provision of any investment advice or service, or as a contractual document. Nothing in this document constitutes an investment, legal, tax or accounting advice or a representation that any investment or strategy is suitable or appropriate for an investor's particular and individual circumstances, nor does it constitute a personalized investment advice for any investor. This document reflects the information, opinions and comments of Bank Syz Ltd. as of the date of its publication, which are subject to change without notice. The opinions and comments of the authors in this document reflect their current views and may not coincide with those of other Syz Group entities or third parties, which may have reached different conclusions. The market valuations, terms and calculations contained herein are estimates only. The information provided comes from sources deemed reliable, but Bank Syz Ltd. does not guarantee its completeness, accuracy, reliability and actuality. Past performance gives no indication of nor guarantees current or future results. Bank Syz Ltd. accepts no liability for any loss arising from the use of this document.
Read More

Straight from the Desk

Syz the moment

Live feeds, charts, breaking stories, all day long.

Thinking out loud

Sign up for our weekly email highlighting the most popular posts.

Follow us

Thinking out loud

Investing with intelligence

Our latest research, commentary and market outlooks