Chart #2 —
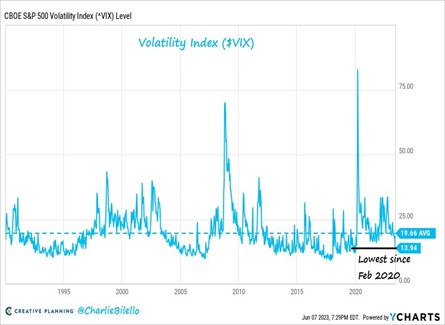
The VIX is back to pre-pandemic levels
The VIX – also known as the "fear index" - fell below 14 over the past week, its lowest level since February 2020. A VIX at very low levels is synonymous with investor complacency.
VIX is short for Chicago Board Options Exchange Volatility Index. It is a measurement instrument used to track the volatility of the S&P 500 index and is the best-known volatility index on the market.
Source: Charlie Bilello
Chart #3 —
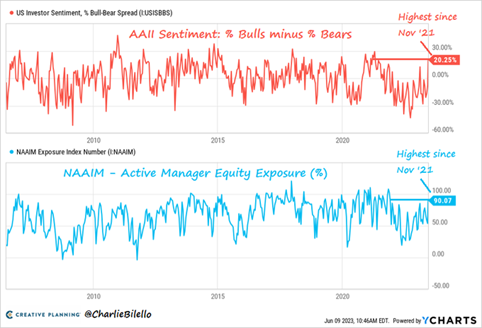
Investors are becoming increasingly optimistic
In another sign of market complacency, various investor opinion surveys show a clear rise in the level of optimism. The AAII Sentiment Poll (conducted among individual investors in the USA) shows that the percentage of "bulls" is 20% higher than the percentage of "bears", the widest gap since November 2021.
The NAAIM Active Manager Exposure survey (conducted among active managers in the USA) shows a "net long" level of 90%, also the highest level since autumn 2021.
Source: Charlie Bilello
Chart #4 —
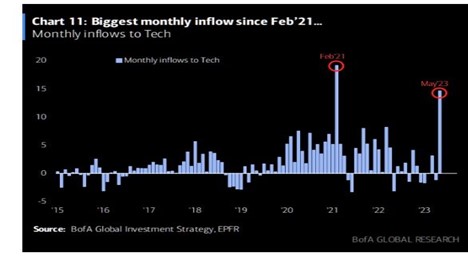
Investors are chasing technology stocks
The Nasdaq index is by far the best performer among US equity indices since the start of the year (+26.7% versus +2% for the Dow Jones). In recent weeks, many investors have been adjusting their portfolios by accumulating technology stocks. This is evidenced by inflows in May, which reached their highest level since February 2021.
Source: BofA, TME
Chart #5 —
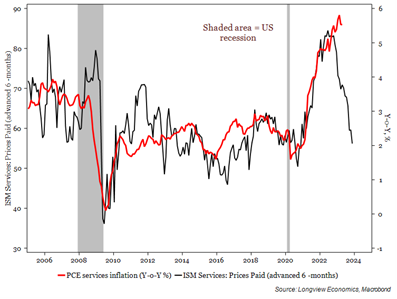
US ISM index shows downward pressure on prices
Among last week's macroeconomic highlights was the ISM purchasing managers' survey in the USA. Admittedly, the index itself shows a sharp contraction in service-related sectors, but the market took a positive view of the continuing fall in the price component, which points to a decline in service-related inflation.
Source: Longview Economics, Macrobond
Chart #6 —
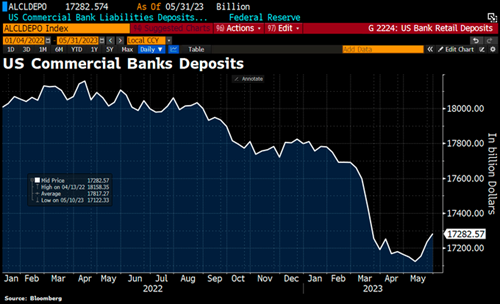
Is the US banking crisis on the verge of resolution?
Deposits with US banks rose for the 3rd week running (+46.6 billion dollars).
Source: Bloomberg
Chart #7 —
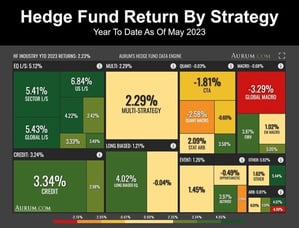
Hedge funds up 2.2% since the start of the year
According to Aurum Research, hedge funds (on an aggregated basis) are up 2.2% in the first 5 months of 2023, with long/short equity funds posting the best performance.
Source: Aurum Research
Disclaimer
This marketing document has been issued by Bank Syz Ltd. It is not intended for distribution to, publication, provision or use by individuals or legal entities that are citizens of or reside in a state, country or jurisdiction in which applicable laws and regulations prohibit its distribution, publication, provision or use. It is not directed to any person or entity to whom it would be illegal to send such marketing material. This document is intended for informational purposes only and should not be construed as an offer, solicitation or recommendation for the subscription, purchase, sale or safekeeping of any security or financial instrument or for the engagement in any other transaction, as the provision of any investment advice or service, or as a contractual document. Nothing in this document constitutes an investment, legal, tax or accounting advice or a representation that any investment or strategy is suitable or appropriate for an investor's particular and individual circumstances, nor does it constitute a personalized investment advice for any investor. This document reflects the information, opinions and comments of Bank Syz Ltd. as of the date of its publication, which are subject to change without notice. The opinions and comments of the authors in this document reflect their current views and may not coincide with those of other Syz Group entities or third parties, which may have reached different conclusions. The market valuations, terms and calculations contained herein are estimates only. The information provided comes from sources deemed reliable, but Bank Syz Ltd. does not guarantee its completeness, accuracy, reliability and actuality. Past performance gives no indication of nor guarantees current or future results. Bank Syz Ltd. accepts no liability for any loss arising from the use of this document.
Related Articles
Meanwhile, the Korean stock market surges to new levels. Each week, the Syz investment team takes you through the last seven days in seven charts.
Meanwhile, bitcoin and software equities are moving like twins. Each week, the Syz investment team takes you through the last seven days in seven charts.
While gold, silver and platinum were the best performing commodities over the past year, they took a hit at the end of last week. Each week, the Syz investment team takes you through the last seven days in seven charts.


.png)
