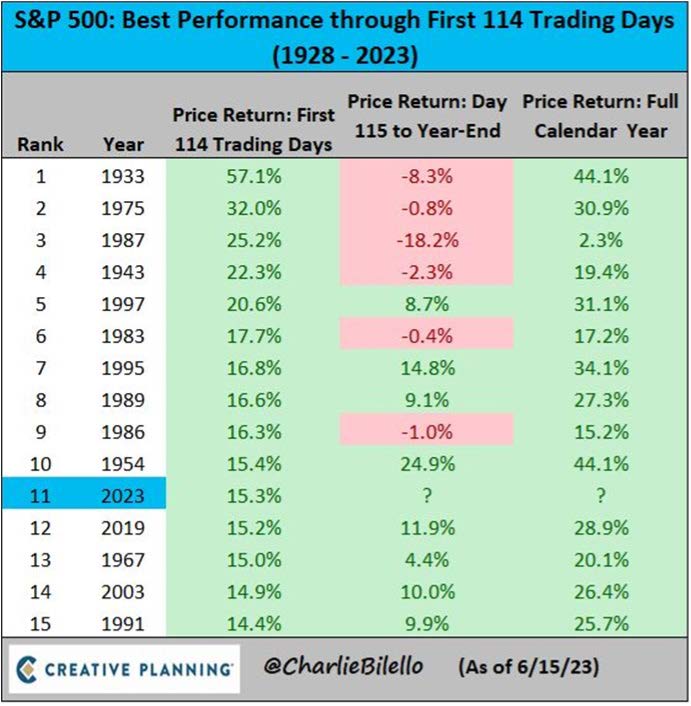
Chart #2 —
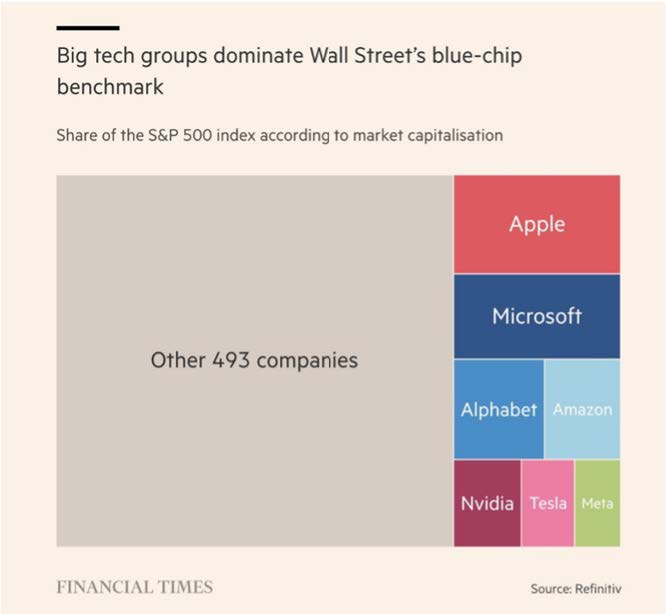
Tech's big names dominate the S&P 500
The "Magnificent Seven" dominate the S&P 500, accounting for the majority of this year's gains.
Apple, Microsoft, Alphabet Inc, Amazon, NVIDIA, Tesla and Meta represent a market capitalization of $10.8 trillion, compared with $25.8 trillion for the rest of the 493 stocks that make up the S&P 500.
Advances in generative AI and the prospect of an imminent end to the cycle of rising interest rates have sent US stocks soaring.
Source: FT
Chart #3 —
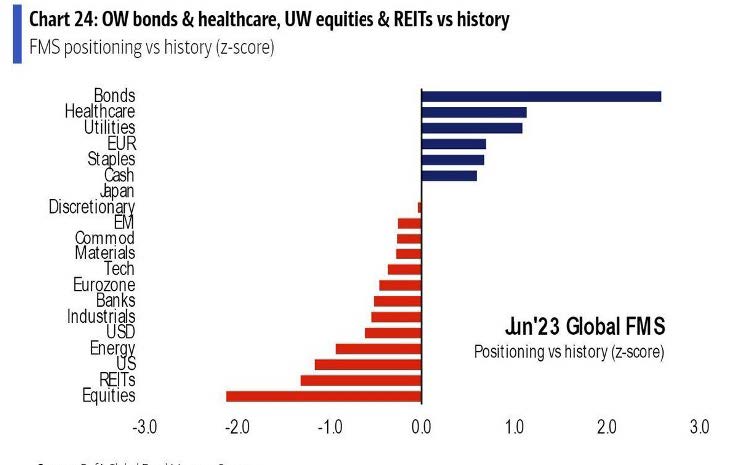
Fund managers remain defensively
positioned
The main feature of fund managers' positioning (at least according to the BofA survey) is their overweighting of bonds and underweighting of equities... From a contrarian point of view, this is positive for equities, as it means that many fund managers will have to "chase" the upside
Source: BofA
Chart #4 —
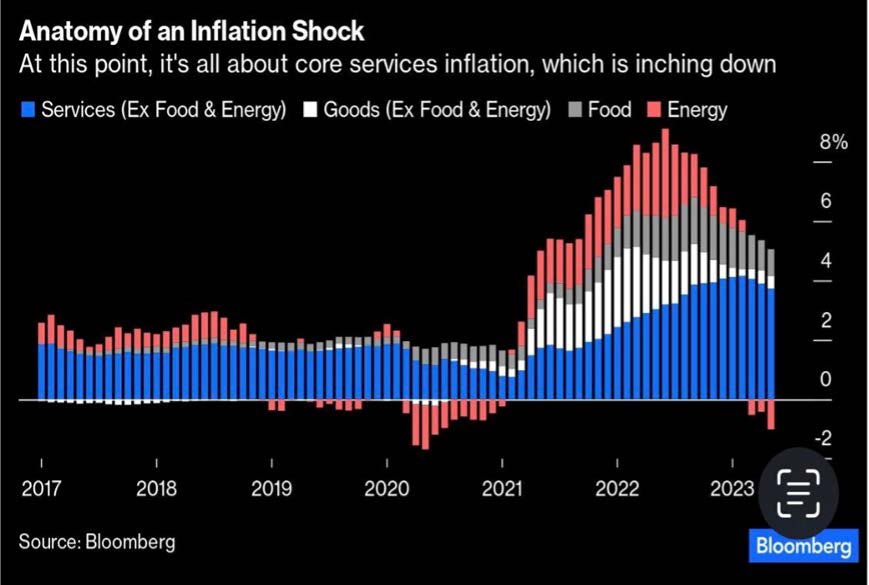
US inflation at 2-year low
The US consumer price index rose at an annual rate of 4% in May, the lowest figure in over two years, reported the US Bureau of Labor Statistics in its latest inflation report. The "core CPI", which excludes volatile energy and food prices, remained stubbornly high, however. Economists are concerned.
Categories such as housing, car insurance, leisure, household furnishings and operations, as well as new vehicles, are among those that have seen notable annual increases, the bureau said.
The chart above (courtesy of John Authers) illustrates the migration of inflationary pressures from goods to services. History has taught central banks not to fall behind in the fight against inflation. Once they do, as has happened to the Fed, inflation becomes more entrenched, less sensitive to interest rates and takes longer to fall back to lower levels.
Source: Bloomberg
Chart #5 —
U.S. Federal Reserve pause in June FOMC
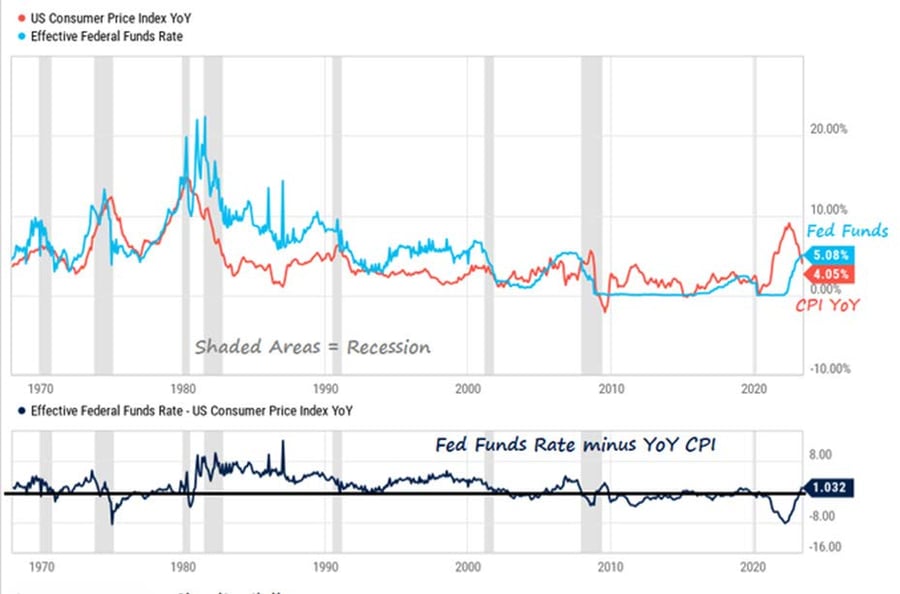
As expected, the Fed chose not to raise interest rates after more than a year of hikes. It did, however, signal that this pause could be temporary. The Fed's projections call for two further 25bp hikes this year. Powell said the process of returning to the 2% target "still has a long way to go".
Powell added that long-term inflation expectations seem "well anchored". The federal funds rate is now more than 1% above the US inflation rate. We need to go back to October 2007 to find a positive real interest rate.
Source: www.zerohedge.com, Bloomberg
Chart #6 —
No respite for the ECB
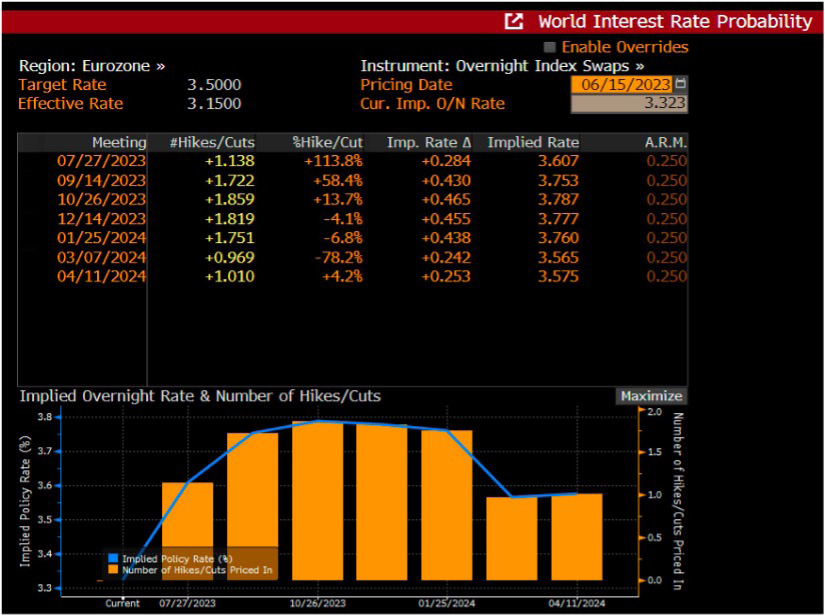
The ECB raised the interest rate on its main refinancing operations from 3.75% to 4%, as planned. This is the eighth consecutive increase, and the rate is now at its highest level since 2001. The tone was "hawkish", with Madame Lagarde declaring that the ECB was "very likely" to raise rates in July. Markets estimate the probability of a July hike at 114%.
The ECB significantly increased its core inflation forecast to 5.1% from the 4.6% expected in 2023 - "Inflation is likely to remain too high for too long". The ECB has also cut eurozone growth forecasts to 0.9% for 2023 and 1.5% for 2024. In short, higher inflation forecasts, lower growth forecasts... During the conference call, Ms. Lagarde explained that she was concerned that wage growth was not slowing down.
This is a clear signal that the ECB will continue to raise interest rates. A July hike now seems a foregone conclusion.
Source: Bloomberg
Chart #7 —
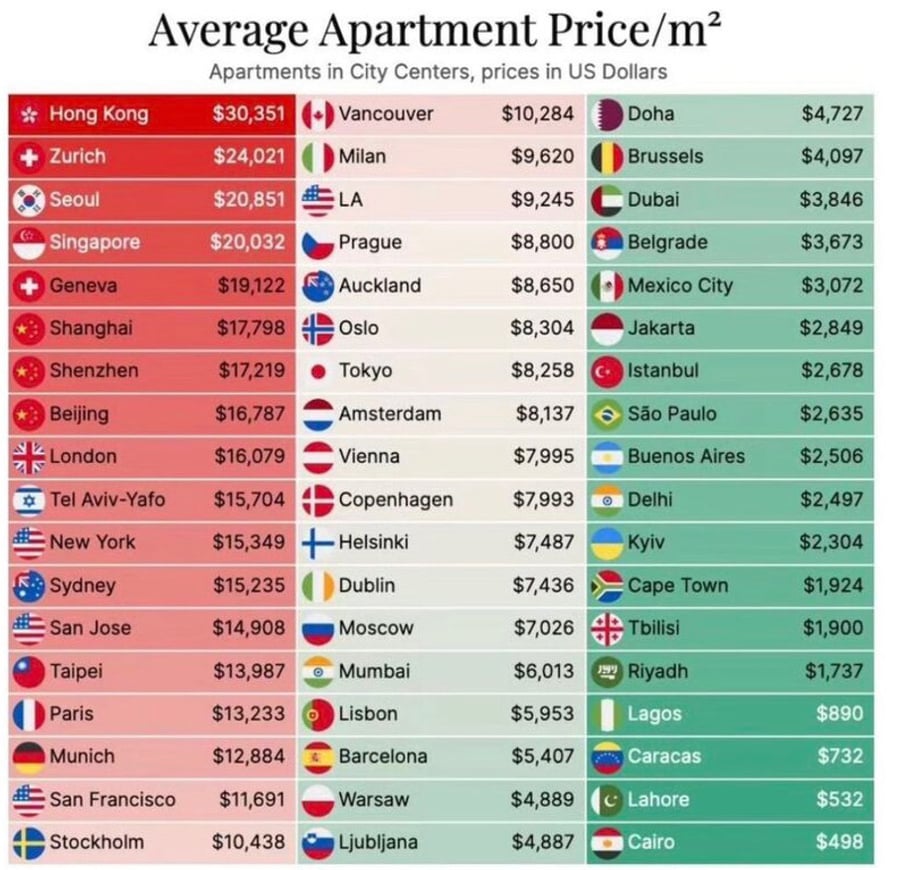
Ranking of average price per m2 in different city centers
These are prices at the end of 2022. Hong Kong, Zurich, and Seoul are in the top three. Geneva is not far behind. Dubai looks cheap...
Source: Willem Middelkoop
Disclaimer
This marketing document has been issued by Bank Syz Ltd. It is not intended for distribution to, publication, provision or use by individuals or legal entities that are citizens of or reside in a state, country or jurisdiction in which applicable laws and regulations prohibit its distribution, publication, provision or use. It is not directed to any person or entity to whom it would be illegal to send such marketing material. This document is intended for informational purposes only and should not be construed as an offer, solicitation or recommendation for the subscription, purchase, sale or safekeeping of any security or financial instrument or for the engagement in any other transaction, as the provision of any investment advice or service, or as a contractual document. Nothing in this document constitutes an investment, legal, tax or accounting advice or a representation that any investment or strategy is suitable or appropriate for an investor's particular and individual circumstances, nor does it constitute a personalized investment advice for any investor. This document reflects the information, opinions and comments of Bank Syz Ltd. as of the date of its publication, which are subject to change without notice. The opinions and comments of the authors in this document reflect their current views and may not coincide with those of other Syz Group entities or third parties, which may have reached different conclusions. The market valuations, terms and calculations contained herein are estimates only. The information provided comes from sources deemed reliable, but Bank Syz Ltd. does not guarantee its completeness, accuracy, reliability and actuality. Past performance gives no indication of nor guarantees current or future results. Bank Syz Ltd. accepts no liability for any loss arising from the use of this document.
Related Articles
Meanwhile, the Korean stock market surges to new levels. Each week, the Syz investment team takes you through the last seven days in seven charts.
Meanwhile, bitcoin and software equities are moving like twins. Each week, the Syz investment team takes you through the last seven days in seven charts.
While gold, silver and platinum were the best performing commodities over the past year, they took a hit at the end of last week. Each week, the Syz investment team takes you through the last seven days in seven charts.


.png)
