Charles-Henry Monchau

Chief Investment Officer

Chart #1 — 

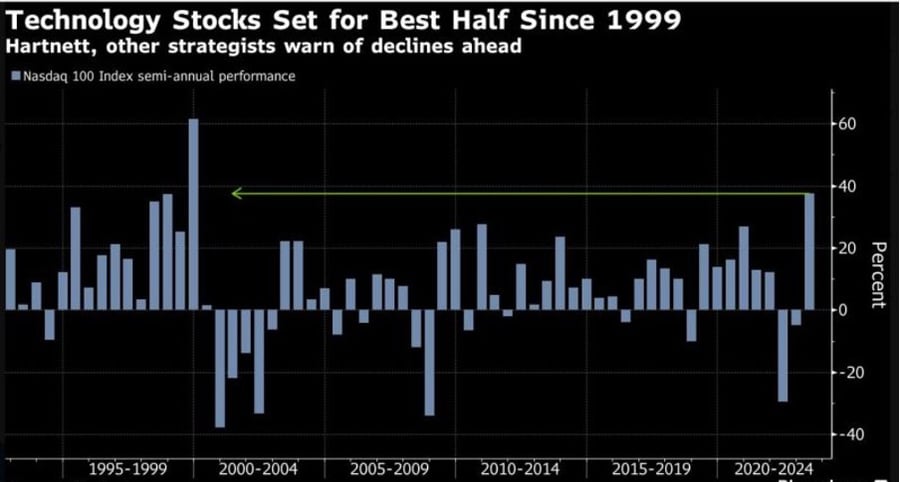
Nasdaq on track for best first half since 1999 

The main US stock indices closed lower in a trading week shortened by the vacations. The Nasdaq suffered its first weekly decline in two months (-1.4%), while the S&P 500 recorded its first drop in six weeks (also -1.4%). Despite this weekly decline, the Nasdaq 100 could well record its best first-half advance since 1999, the year of the dot-com bubble.

pic 1 -nasdaq

Source: Bloomberg


Chart #2 — 

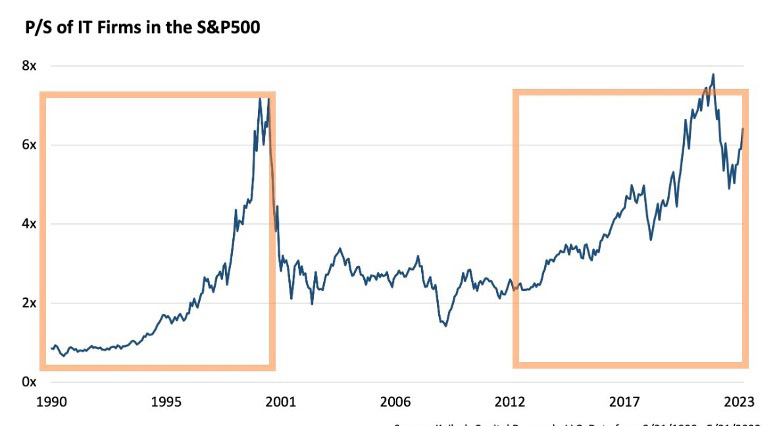
S&P 500 as expensive as in 2000

The S&P 500 index of US equities is currently heavily represented in technology stocks, which are benefiting from the "buzz" surrounding artificial intelligence.

As a result, the price/revenue ratio of the S&P 500 is close to 7x, a level not seen since the dot-com bubble of 1999-2000.

pic 2 - sp500

Source:Kallash Capital Research, Christof Leisinger


Chart #3 — 

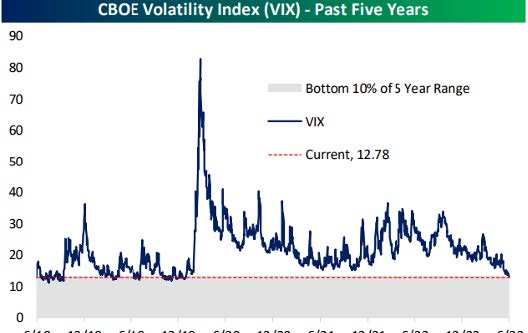
VIX falls below 13

The VIX (Chicago Board Options Exchange Volatility Index) is used to track the volatility of the S&P 500 index. It is often referred to as the stock market's fear index. A high number means that investor anxiety is high. A low number means market complacency.

For the first time since January 23, 2020, the VIX has fallen below 13, despite a number of risks well known to investors (Russia-Ukraine conflict, risk of recession, banking crisis, inflation, etc.).

pic 3 -VIX falls below 13

Source: Bespoke


Chart #4 — 

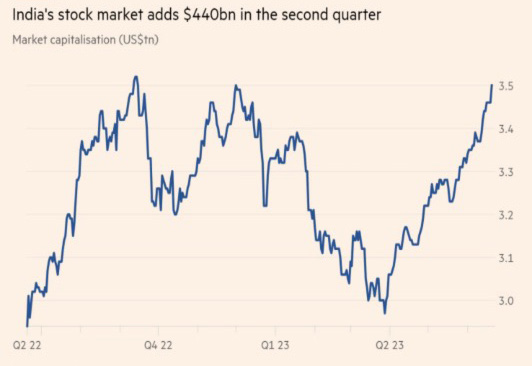
Market capitalization of Indian equities at an all-time high

The Indian stock market continues to grow, and has returned to the levels of market capitalization that prevailed at the
end of 2022. The value of the equity market rose by $440 billion in Q2. International investors are increasingly buying into the idea that the country is poised to overtake China as
the engine of global economic growth, as India is far less exposed to geopolitical risks than its Chinese "neighbor".

pic 4 - Market capitalization of Indian equities

Source: FT


Chart #5 — 

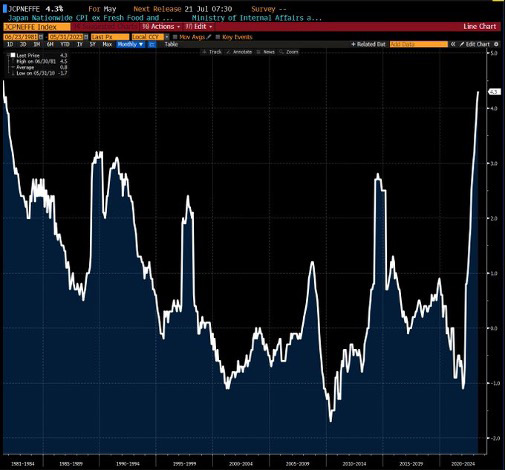
Core inflation in Japan highest since
early 80s   

Inflation excluding fresh food and energy costs in Japan for the month of May was higher than expected at 4.3% year-on-year, a 42-year high.

Core inflation in Japan highest since

Source: David Ingles, Bloomberg


Chart #6 — 

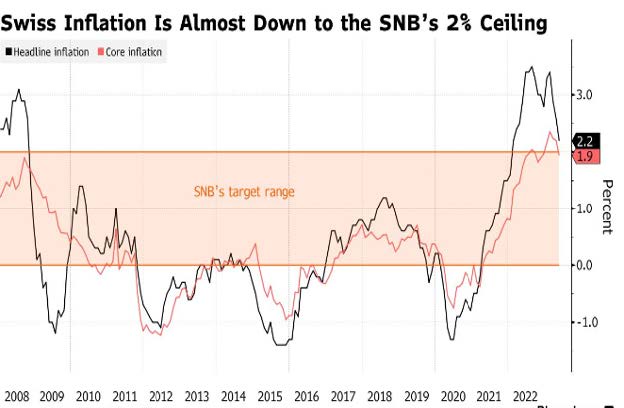
SNB raises key interest rate again despite good progress on the inflation front


The SNB has decided to raise interest rates by a further 25 basis points, despite the fact that inflation in Switzerland is close to the SNB's 2 percent ceiling. A further 25 basis point hike in September seems likely, as the SNB appeared so determined at the press conference following last week's rate hike announcement.

chart 6 -Core inflation in Japan highest since

Source: Bloomberg, Office fédérale de la statistique


Chart #7 — 

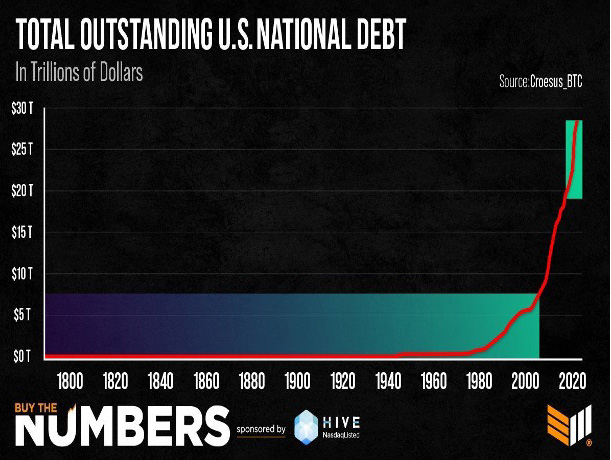
US federal government debt soars


It took 215 YEARS for US debt to reach $7 trillion. It took only 3 years (since March 2020) to add the next $7 trillion
in debt.


chart7 -Core inflation in Japan highest since

Source: Croesus_BTC, Hive

Disclaimer

This marketing document has been issued by Bank Syz Ltd. It is not intended for distribution to, publication, provision or use by individuals or legal entities that are citizens of or reside in a state, country or jurisdiction in which applicable laws and regulations prohibit its distribution, publication, provision or use. It is not directed to any person or entity to whom it would be illegal to send such marketing material. This document is intended for informational purposes only and should not be construed as an offer, solicitation or recommendation for the subscription, purchase, sale or safekeeping of any security or financial instrument or for the engagement in any other transaction, as the provision of any investment advice or service, or as a contractual document. Nothing in this document constitutes an investment, legal, tax or accounting advice or a representation that any investment or strategy is suitable or appropriate for an investor's particular and individual circumstances, nor does it constitute a personalized investment advice for any investor. This document reflects the information, opinions and comments of Bank Syz Ltd. as of the date of its publication, which are subject to change without notice. The opinions and comments of the authors in this document reflect their current views and may not coincide with those of other Syz Group entities or third parties, which may have reached different conclusions. The market valuations, terms and calculations contained herein are estimates only. The information provided comes from sources deemed reliable, but Bank Syz Ltd. does not guarantee its completeness, accuracy, reliability and actuality. Past performance gives no indication of nor guarantees current or future results. Bank Syz Ltd. accepts no liability for any loss arising from the use of this document.
Read More

Straight from the Desk

Syz the moment

Live feeds, charts, breaking stories, all day long.

Thinking out loud

Sign up for our weekly email highlighting the most popular posts.

Follow us

Thinking out loud

Investing with intelligence

Our latest research, commentary and market outlooks