Chart #2 —
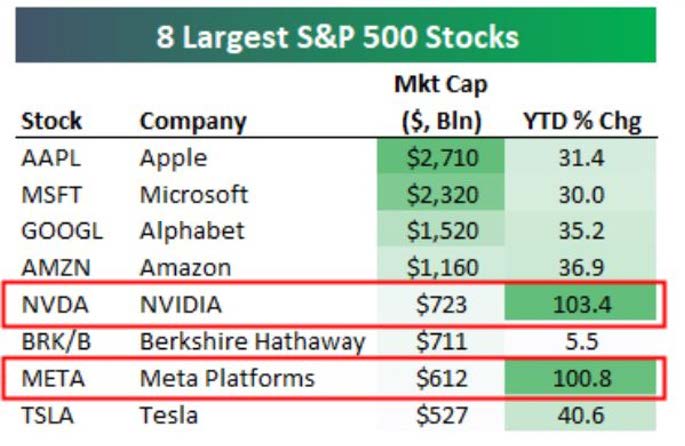
The very large market capitalizations of the S&P 500 are up strongly since the beginning of the year
Nvidia and Meta Platforms are both up over 100% year-to-date. They are the two best-performing stocks in the S&P 500 in 2023, and two of the seven largest by market capitalization.
Source: Bespoke
Chart #3 —
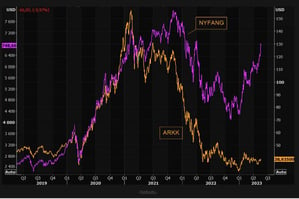
Cathie Wood's ARK Invest fund sharply underperforms the FAANGs
While the FAANGs (Meta, Apple, Amazon, Alphabet, etc.) have already made up much of the 2022 decline, Cathie Wood's Ark Invest Innovation fund has rebounded only slightly from last year's lows.
Source: TME, Refinitiv
Chart #4 —
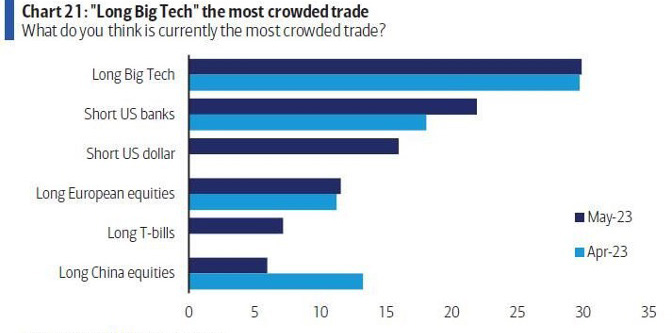
Long Mega-cap tech stocks is the most crowded trade according to BofA
According to BofA's May 2023 survey of fund managers, going long on large technology companies is seen as the most popular position. The "short" position on U.S. banks is next.
Source: BofA
Chart #5 —
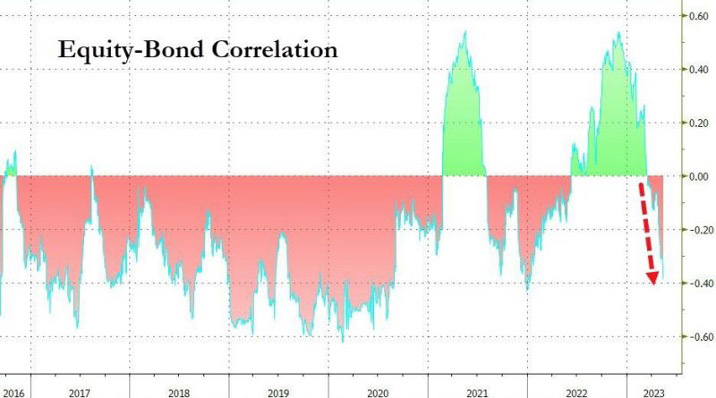
The correlation between stocks and bonds is negative again
With markets expecting a recession in the second half of this year, bonds are once again seen as a diversifying asset by multi-asset portfolio managers. Note that the correlation between U.S. Treasury bonds and the S&P 500 has become clearly negative again.
Source: Bloomberg
Chart #6 —
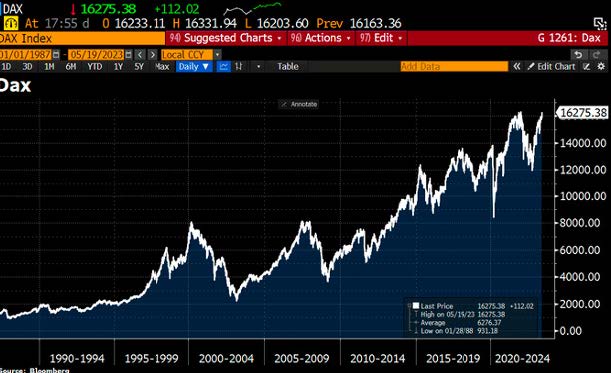
German equity DAX index at all-time high
The German benchmark Dax index ended the week up 2.27%, with a new closing record of 16275.38. Since the beginning of the year, it has gained 2351.79 points, or 16.9%. Since its inception in late 1987, the Dax has recorded an annualized performance of 8.4% compared to 10.6% for the S&P 500.
Source: Bloomberg
Chart #7 —
Ferrari as an anti-fragile asset?
The waiting list for a new Ferrari now extends to 2025. The Daytona SP3 model, of which Ferrari plans to produce only 599 units, has a base price of $2.25 million and was sold out before it was even unveiled. Meanwhile, Ferrari stock ($RACE) is near all-time highs with a market cap of $53 billion. The stock is up 36% year-to-date and trades at a price-to-earnings ratio of 49x.

Image source: motori.leggo.it
Disclaimer
This marketing document has been issued by Bank Syz Ltd. It is not intended for distribution to, publication, provision or use by individuals or legal entities that are citizens of or reside in a state, country or jurisdiction in which applicable laws and regulations prohibit its distribution, publication, provision or use. It is not directed to any person or entity to whom it would be illegal to send such marketing material. This document is intended for informational purposes only and should not be construed as an offer, solicitation or recommendation for the subscription, purchase, sale or safekeeping of any security or financial instrument or for the engagement in any other transaction, as the provision of any investment advice or service, or as a contractual document. Nothing in this document constitutes an investment, legal, tax or accounting advice or a representation that any investment or strategy is suitable or appropriate for an investor's particular and individual circumstances, nor does it constitute a personalized investment advice for any investor. This document reflects the information, opinions and comments of Bank Syz Ltd. as of the date of its publication, which are subject to change without notice. The opinions and comments of the authors in this document reflect their current views and may not coincide with those of other Syz Group entities or third parties, which may have reached different conclusions. The market valuations, terms and calculations contained herein are estimates only. The information provided comes from sources deemed reliable, but Bank Syz Ltd. does not guarantee its completeness, accuracy, reliability and actuality. Past performance gives no indication of nor guarantees current or future results. Bank Syz Ltd. accepts no liability for any loss arising from the use of this document.
Related Articles
Oracle bets on OpenAI and Santa continuously delivers S&P 500 gains during the holidays. Each week, the Syz investment team takes you through the last seven days in seven charts.
Inflation remains Americans’ top concern while Swiss inflation hit zero. Each week, the Syz investment team takes you through the last seven days in seven charts.
Meanwhile, Big Tech carries the S&P 500. Each week, the Syz investment team takes you through the last seven days in seven charts.


.png)
