Trend #1 —
Government bonds provide no hedge / only Gold does
This is the first equity correction in the Quantitative Easing (QE) era with Government Bonds yields going higher.
Indeed, bonds have been ineffective as a hedge against equity since the November 2021 peak and that was again the case last week. US Treasury yields have come in but only modestly as the US 10 year is trading close to 1.9% at the time of our writing. Even in Germany, yields are off their highs, but holding above 0%.
S&P 500

Source: Bloomberg
US 10-Year Yield

Source: Bloomberg
We continue to believe that bonds offer no hedge to equities. This has historically been the case during times of inflation. Between 1965 and 1982, equity and bond selloffs were simultaneous. We continue to keep a very small exposure to government bonds in diversified portfolios.
At the moment, gold is the only hedge paying off. As shown on the chart below, Gold has been the only true portfolio diversifier since the start of the year – although the performance is far from spectacular. We keep our exposure to Gold in our discretionary portfolios.
Gold vs. selected assets

Source: Bloomberg
Trend #2 —
The economy should do fine but more supply disruptions are likely
We continue to believe that global GDP should grow above potential this year, although there are downside risks stemming from the Russia-Ukraine war. Indeed, the direct trade link between the US and Russia is almost insignificant, at only 0.4% of US exports. Even in Europe, the link is limited to just 0.6% of their GDP. However, Russia is an important supplier of European energy accounting for 40% of natural gas and 24% of crude oil imports, which is what creates the real risk to consumer demand and corporate profits. As of now, European natural gas prices halted their record-breaking rally as Russia ramps up flows to Germany (through Ukraine…). The flows will continue as long as Russia is not fully banned from the international financial messaging service SWIFT. But if additional sanctions lead to a ban of all SWIFT payments and / or Russian energy flows are blocked, European Natural Gas prices are likely to soar and might trigger electricity supply disruptions – with obvious negative impacts on growth.
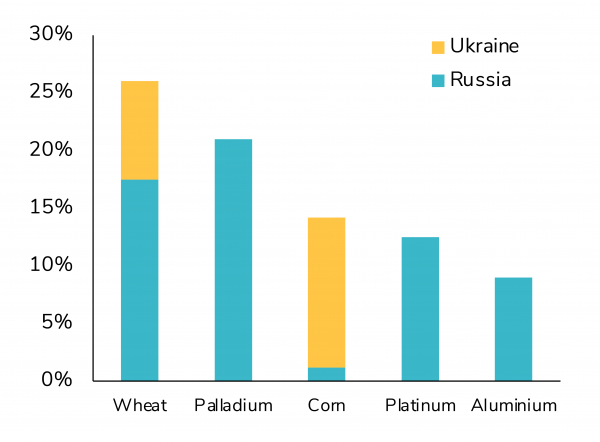
Moreover, given Russia’s role as a commodity superstore, the economic impact of this crisis could extend well beyond energy and exacerbate current global supply and inflationary dynamics. Indeed, Russia and Ukraine combined account for 25% of global wheat exports and Ukraine alone for 13% of corn exports.
Russian& Ukrainian Non-Energy Commodity Exports % of Global Exports

Source: RBC
Trend #3 —
War on inflation is still the key risk for investors
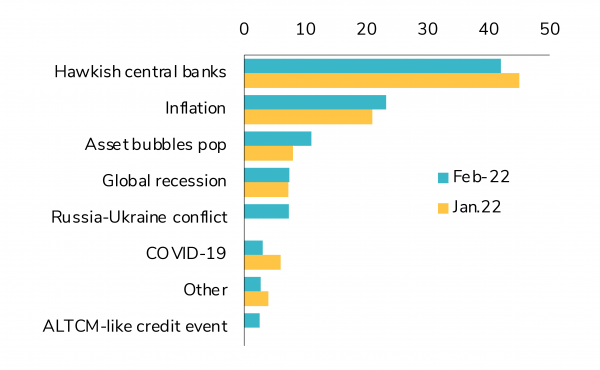
According to the February Fund Manager Survey by Bank of America (published in early February – see below), hawkish central banks was by far the biggest tail risk. As the Russia-Ukraine war is now raging, will geopolitics take the center stage? Interestingly, the biggest tail risks are somewhat related - and even compounding... Indeed, the full- scale Russia-Ukraine conflict could actually lead to higher inflation, more hawkish central banks, more asset bubbles popping and thus higher global recession risk....
Hawkish central banks remains the biggest "tail risk"
What do you consider the biggest "tail risk"?

Source: BofA Global Fund Manager Survey
As mentioned earlier, the war could lead to additional commodity supply disruptions, including on the energy side. While oil prices haven’t reached new highs since Thursday, the backwardation in WTI's term structure is at a record high, suggesting a seriously tight market. High energy prices continue to pose upside risks to inflation in 2022.
Trend #4 —
We expect central banks to act despite the war
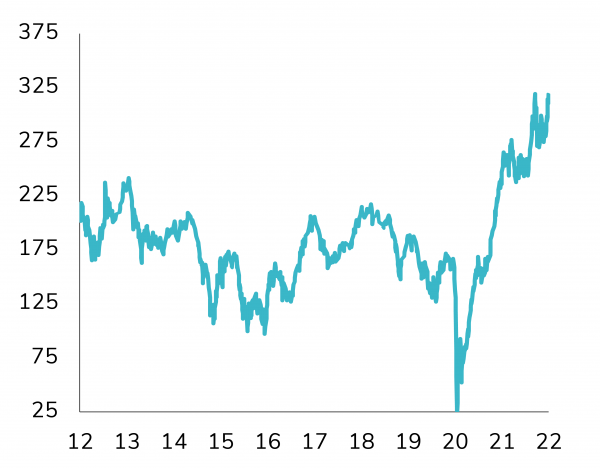
One of the reasons behind last Thursday’s intra-day equity market reversal is “hope” by some market participants that central banks will slow down their monetary policy normalization process due to the war in Ukraine. We tend to disagree with this view. The Fed actually has more work to do on tightening monetary conditions – not less. The US 5Y Breakevens have been widening (+ 30bps wider at one point last week) due to the war’s impact on commodities. As such, US real yields have turned sharply more negative (instead of rising). Consequently, the Fed has no other choice than to tighten rates. This view is confirmed by market action as odds of 7 rate-hikes by the Fed in 2022 actually rose last week.
5-year breakevens closed at new historic levels

Source: Bloomberg
Trend #5 —
Cross-asset classes volatility is likely to stay high
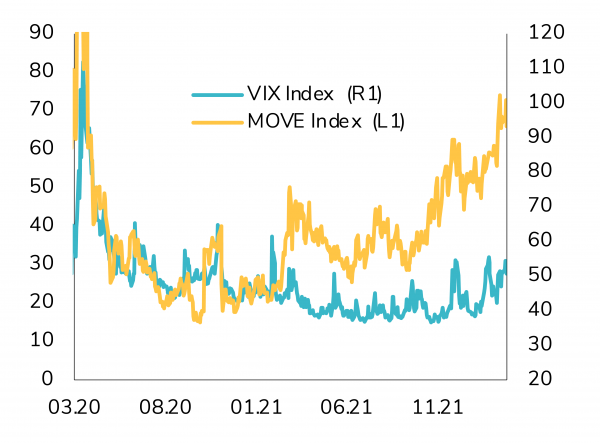
Bond and equity volatility continue to be on the rise (see below Bonds volatility “MOVE” index in green and S&P volatility “VIX” index in purple). However, we feel that we haven’t reached capitulation levels yet, especially on the equity side. This is confirmed by the Put/Call ratio which is not at an extreme oversold level yet. But we are also surprised to see the VIX far below the stress levels that were observed during past market corrections. To our opinion, this means that equity markets could stay volatile in the coming weeks.
In the medium-term, we believe that an attractive buying opportunity could arise. The stock market has a long history of being able to look through geopolitical uncertainties, especially when the macro and corporate fundamentals remain solid. Since 1971, there have been 18 corrections without recession. These market pullbacks have historically good opportunities to add equities, with the S&P 500 index rising 17% six months after and 23% a year later.
The Move index and the VIX index

Source: Bloomberg
Special ISG meeting conclusions
As summarized in last week’s asset allocation insights, we held a special ISG (Investment Strategy Group) meeting last week. The weight of evidence (i.e the aggregated view of our fundamental and technical indicators) led us to downgrade our stance on equities from positive to cautious.
While global growth remains above potential, the Russia- Ukraine crisis creates downside risk at a time when monetary policy is unlikely to provide a strong support to the economy and financial markets. While earnings growth remains positive and while equity valuations are slightly more attractive, our market technical indicators (trend, sentiment, etc.) have been deteriorating lately and thus led us to reduce our stance.
An important point: we have been gradually reducing our exposure to equities and credit over the last few months based not only on fundamental and technical indicators but also on systematic risk balancing. This equity reduction thus came as further step in this de-risking process.
Disclaimer
This marketing document has been issued by Bank Syz Ltd. It is not intended for distribution to, publication, provision or use by individuals or legal entities that are citizens of or reside in a state, country or jurisdiction in which applicable laws and regulations prohibit its distribution, publication, provision or use. It is not directed to any person or entity to whom it would be illegal to send such marketing material. This document is intended for informational purposes only and should not be construed as an offer, solicitation or recommendation for the subscription, purchase, sale or safekeeping of any security or financial instrument or for the engagement in any other transaction, as the provision of any investment advice or service, or as a contractual document. Nothing in this document constitutes an investment, legal, tax or accounting advice or a representation that any investment or strategy is suitable or appropriate for an investor's particular and individual circumstances, nor does it constitute a personalized investment advice for any investor. This document reflects the information, opinions and comments of Bank Syz Ltd. as of the date of its publication, which are subject to change without notice. The opinions and comments of the authors in this document reflect their current views and may not coincide with those of other Syz Group entities or third parties, which may have reached different conclusions. The market valuations, terms and calculations contained herein are estimates only. The information provided comes from sources deemed reliable, but Bank Syz Ltd. does not guarantee its completeness, accuracy, reliability and actuality. Past performance gives no indication of nor guarantees current or future results. Bank Syz Ltd. accepts no liability for any loss arising from the use of this document.
Related Articles
Flash note


.png)