Story 1 —
Invasion of Ukraine
This is, without doubt, the most dramatic and important development of the first half of 2022. Although a Russian incursion into Ukraine appeared plausible at the beginning of the year, Russian President Vladimir Putin's decision to carry out a full-scale war beyond the separatist region of Donbas stunned the world. Beyond the conflict’s human tragedy, sanctions imposed by the West have far-reaching consequences for the global economy and monetary order.
This episode of history comes at a time when the supply of raw materials is already insufficient to meet demand. Meanwhile, Russia produces and exports a vast majority of them: oil, natural gas, industrial metals, precious metals, and agricultural commodities. The global economy, therefore, faces a commodity supply shock, with consequences for both growth (downside risk) and inflation (upside risk). At the time of writing, a rapid end to the war, and therefore to the application of sanctions, seems unlikely. Even if an agreement is reached, the normalization of relations between Russia and the West may take years, for as long as President Putin remains in power.
Story 2 —
Inflation surges while growth decelerates
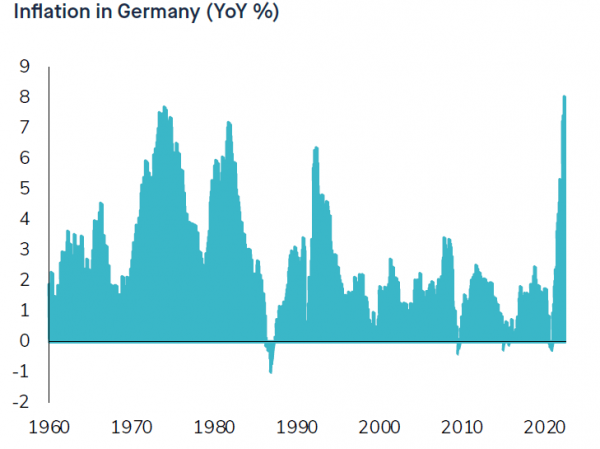
Inflation keeps surprising on the upside, hitting multi-decade highs across the globe. US consumer prices jumped 8.5% from a year earlier in April to a fresh 40-year high on rising petrol, food and housing costs. The US continues to face strong rents and wage inflation. In Europe, Germany’s inflation accelerated in May to 7.9% year-on-year, its highest level since the monthly statistic was first calculated in 1963. While the conflict's immediate impact on the world economy is expected to be limited (Russia's economy accounts for less than 2% of global GDP), rising commodity prices may fuel greater, or at least more persistent, inflation. Sanctions and Covid-related lockdowns in China could both lead to additional supply chain bottlenecks.
Meanwhile, first quarter GDP in the US unexpectedly contracted due to weak exports and a decline in inventory spending. The bright spot was the US consumer spending (see story #5). At the time of our writing, Atlanta Fed Nowcast estimates points towards a stable or even slightly negative real GDP growth for the second quarter, which implies that the US economy could meet the definition of a “technical” recession (i.e two consecutive quarters of negative GDP growth). In the rest of the world, real growth is decelerating as well and many economists now fear that we are entering into a “stagflation” era.
Source: Bloomberg
Story #3 —
The end of easy money
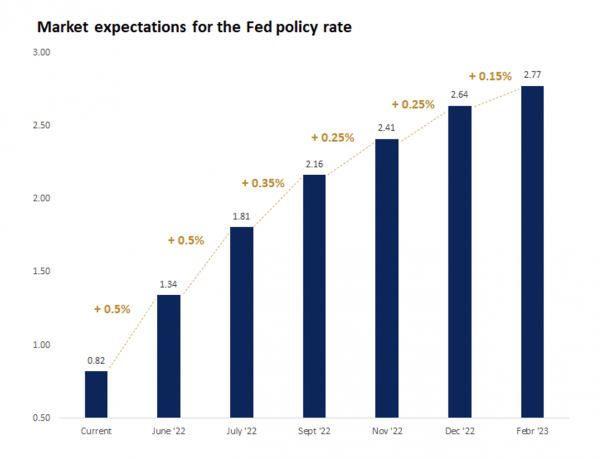
On 16 March, the Fed's FOMC tightened interest rates for the first time since December 2018. While Chairman Jerome Powell initially called post-vaccine inflationary pressures ‘transitory’, Fed officials have moved away from that stance. Through the first half of the year, they signaled their intention to implement multiple rate hikes and also to reduce the size of the Fed’s balance sheet. As expected, the Fed hiked by another 50 basis points (bps) in May and the market expects an additional 50 bps hikes at each of the next two FOMC meetings in June and July.
Meanwhile, investors have been adjusting their expectations accordingly, pricing in a fast and brutal rate hiking cycle in the short-term, with potentially negative consequences on growth and thus rates later on. The European Central Bank (ECB) will probably have no choice but to normalize monetary policy as well. The market is currently pricing more than 100 bps in rate hikes before the year-end.
Source: Bloomberg
Story 4 —
From rates fears to recession fears
From a macroeconomic standpoint, global GDP continues to rise above trend, but forecasts for 2022 have been revised downward aggressively. This has led the market to move from rate fears (or bond yields weighing on equity valuations) to recession fears indeed, rising food and energy costs are likely to dampen consumer spending while companies may be forced to reduce hiring and expenses if rising wages and energy costs weigh on profitability.
Economic indicators point to a sharp slowdown in US growth. In Europe, groups representing German employers and labour unions have jointly opposed an immediate ban on natural gas imports from Russia, saying such a move would lead to factory shutdowns and job losses.
Story 5 —
Resilient corporates and consumers
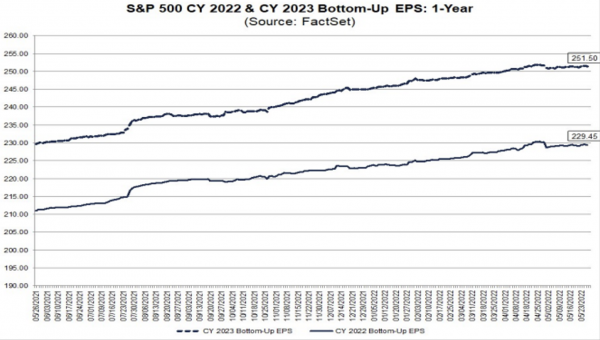
Despite all these negative headlines around war and inflation, there are some bright spots including two areas of relative US economic strength. First, the US consumer remains healthy, unemployment fell to 3.6% – a postpandemic low – and average hourly earnings are increasing at a solid pace of +5.5% year-on-year. US households entered the year with over USD 2.5 trillion more in savings than before the pandemic, offering some cushion in the face of rising borrowing costs. On the corporate side, balance sheets and earnings growth have been resilient and we continue to see earnings revisions for 2022 edging higher. Typically, analysts would revise earnings growth expectations downward for the year faced with the events of 2022’s first quarter. But we have not seen this yet. Expectations for S&P 500 earnings growth are now at 10%, up from 7.0% at the end of 2021.
Source: FactSet
Story 6 —
The worst first half since 1970 for global stocks
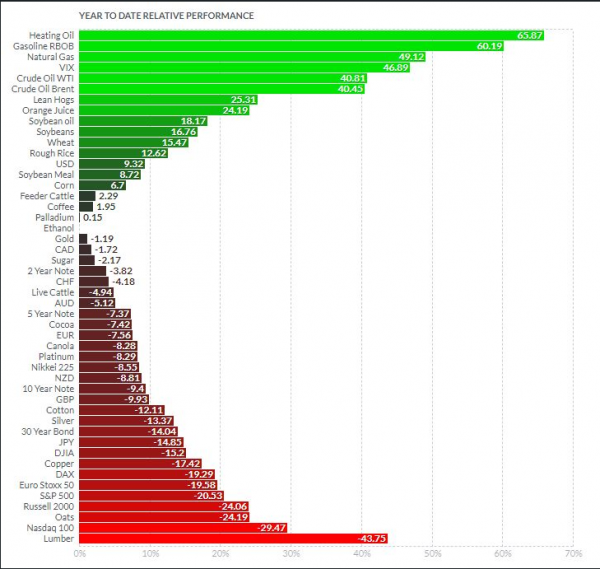
For the first half of the year, the S&P 500 index dropped 20.6%, its largest first-half decline since 1970. It also tumbled into bear market territory, down more than 21% from a record high set early January. The Nasdaq is down 29.5% year-to-date, the worst start to a year ever. European stocks posted their biggest half-year drop since the global financial crisis as the Euro Stoxx 50 recorded a -19.6% decline (in local currency). The MSCI Emerging Markets index fell by -18.4% (in USD). Japan’s Nikkei 225 declined -9.9% in local terms but much worse in dollar terms as the Japanese yen tumbled In terms of style, global value (-6.5% year-to-date) outperformed global growth (-29.5%) by a huge margin.
Story 7 —
No diversification benefits from bond markets
Diversified multi-asset portfolios have suffered in terms of performance since the beginning of the year for obvious reasons. While bonds and equities tend to be weakly or even negatively correlated, the context has been very different in recent months. Not only are the majority of equity markets now down 15-20% since the beginning of the year, but bonds are also posting double-digit negative returns in 2022. The result is one of the worst starts to a year on record for balanced equity/bond portfolios. Indeed, the global bond market just suffered its greatest drawdown on record. The Bloomberg Global Aggregate Bond index is down -13.9% since the start of the year. US Treasuries have dropped -9.1%. Since the US Civil War, 10-year US Treasuries have only seen a worse total return quarter twice: 1) in the early 1980s, and 2) in the fourth quarter of 1931 after the peak of the Depression-based rally. From a sub-sector point of view, US high yield (-14.2%) and EUR high yield (-14.3%) underperformed the aggregate index. Euro government bonds fell -12.2% while emerging markets debt dropped -17.1%.
Story 8 —
Best start to a year for commodities
Commodities were the best performing asset class during the first half of the year. At the end of May, Bloomberg's Commodity Spot Index was up 17.9%. Oil was the standout for many, with Brent crude up almost 40% - oil's best start to a year since 1999. Natural gas soared as well following the Ukrainian invasion. Indeed, Russia is a major commodity exporter, accounting for 13% of global crude oil production and 17% of total natural gas production. Russia accounts for nearly a fifth of the world’s wheat exports, together with Ukraine. As a result, an interruption to supplies of energy and other agricultural goods creates a significant upside risk for commodities.
However, performance was not positive across all commodities segments. After a decent first quarter, industrial metals ended the period in negative territory as Covid lockdowns in China weighed on industrial activity and threatened to dampen metals imports. Copper is down -17.4% over the semester.
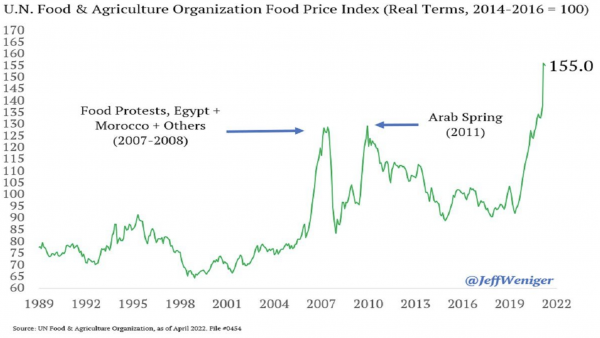
Precious metals posted performance was negative as well. Gold is down -1.2% during the first half while Silver is down -13.4%. Meanwhile, food prices surged to record highs before retreating somewhat in June. We note that food inflation was the source of much social unrest and political regime change in the past. The current spike in food prices may lead to major protests during the next few months.
Source:UN Food & Agriculture Organization, as of April 2022
Story 9 —
The big rotation
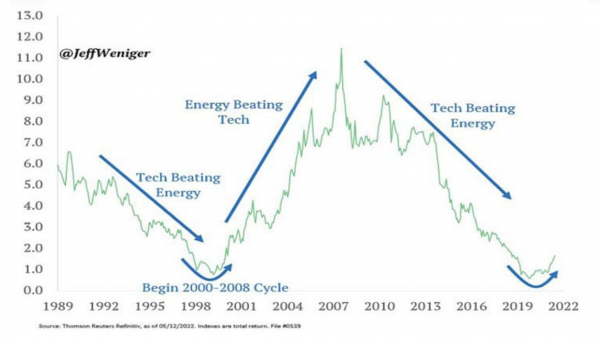
The Nasdaq strongly outperformed other major US equity indices over the past decade, with an annualised return of 18% per year between 2010 and 2019. Over the same period, the energy sector has been one of the worst performers, rising just 3.3% per year between 2010 and 2019, compared with a 13.4% annual return for the S&P 500.
Since the start of 2021, the balance has completely shifted. An energy ETF ($XLE) is up 82% versus a -11% decline for the QQQ (Nasdaq 100 ETF). As the chart below shows, the relative over- and under-performance trends are part of long-term trends. For example, technology stocks outperformed energy stocks between 1990 and 2000. Then between 2000 and 2008, it was energy's turn to dominate. The trend shifted again between 2008 and 2020 with the strong relative outperformance of technology stocks compared with the energy sector. Is energy’s outperformance since 2021 part of a long-term trend that could continue into the current decade?
Source: Thomson, Reuters
Story 10 —
Strong dollar. Worst start of a year ever for cryptocurrencies
The dollar performed strongly in the first half of the year. Expectations for faster monetary tightening in the US contributed to a rally in the currency, which had gained 9.3% in the first half. Surprisingly, the Russian ruble is one of the best-performing currencies of 2022, up 17% year-to-date. The Turkish lira is the worst performing with a fall of almost -30%. Brazil’s real (+7.5%) appreciated on the back of strong commodity markets.
Cryptocurrencies had their worst start to a year ever. The general move to asset liquidation, in place since November 2021, is affecting the most speculative segments of the market even more. Cryptocurrencies had already suffered a dramatic decline, which then accelerated with the fall of the TerraUSD (UST) ‘stablecoin.’ Stablecoins play an important role in the cryptocurrency ecosystem. In principle, they allow cryptocurrency investors to ‘park’ their assets in digital assets that replicate the evolution of ‘fiat’ currencies such as the dollar or euro. These are therefore supposed to be stable because they are backed by ‘traditional’ currencies.
The sudden de-anchoring of the TerraUSD in mid-May sent shockwaves through the crypto markets. The de-pegging of the TerraUSD threw all stablecoins into turmoil, including Tether, which accounts for almost half of the capitalization of this segment. For now, Tether's peg seems to be holding. In fact, it is the stablecoins based on algorithms (such as TerraUSD) that have crashed while those based on physical reserves (Tether, USDC, etc.) are holding up - for now. These spectacular dips have nevertheless cast a cloud over the whole crypto universe. Bitcoin is fell nearly 60% during the first half. Ethereum was worse, falling 72% year-to-date. The market capitalisation of all cryptos has dropped below $1 trillion for the first time since early 2021.
Source: finviz
Disclaimer
This marketing document has been issued by Bank Syz Ltd. It is not intended for distribution to, publication, provision or use by individuals or legal entities that are citizens of or reside in a state, country or jurisdiction in which applicable laws and regulations prohibit its distribution, publication, provision or use. It is not directed to any person or entity to whom it would be illegal to send such marketing material. This document is intended for informational purposes only and should not be construed as an offer, solicitation or recommendation for the subscription, purchase, sale or safekeeping of any security or financial instrument or for the engagement in any other transaction, as the provision of any investment advice or service, or as a contractual document. Nothing in this document constitutes an investment, legal, tax or accounting advice or a representation that any investment or strategy is suitable or appropriate for an investor's particular and individual circumstances, nor does it constitute a personalized investment advice for any investor. This document reflects the information, opinions and comments of Bank Syz Ltd. as of the date of its publication, which are subject to change without notice. The opinions and comments of the authors in this document reflect their current views and may not coincide with those of other Syz Group entities or third parties, which may have reached different conclusions. The market valuations, terms and calculations contained herein are estimates only. The information provided comes from sources deemed reliable, but Bank Syz Ltd. does not guarantee its completeness, accuracy, reliability and actuality. Past performance gives no indication of nor guarantees current or future results. Bank Syz Ltd. accepts no liability for any loss arising from the use of this document.
Related Articles
Meanwhile, the Korean stock market surges to new levels. Each week, the Syz investment team takes you through the last seven days in seven charts.
Meanwhile, bitcoin and software equities are moving like twins. Each week, the Syz investment team takes you through the last seven days in seven charts.
While gold, silver and platinum were the best performing commodities over the past year, they took a hit at the end of last week. Each week, the Syz investment team takes you through the last seven days in seven charts.


.png)