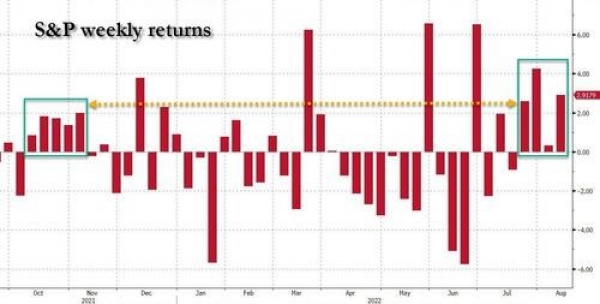
US equities are extending their rebound that began in mid-June. The week's pleasant surprise came from US inflation figures, which are finally showing signs of inflection (see point #5). The S&P 500 index rose by over 3%, marking the fourth consecutive week of gains and the longest period of positive weekly performance since November. The S&P has now erased 50% of the decline it suffered between its all-time high in January and its low point in June. Since the beginning of the year, however, the main US index remains clearly in the red (-10.2%).
Chart#1 - The summer rally continues
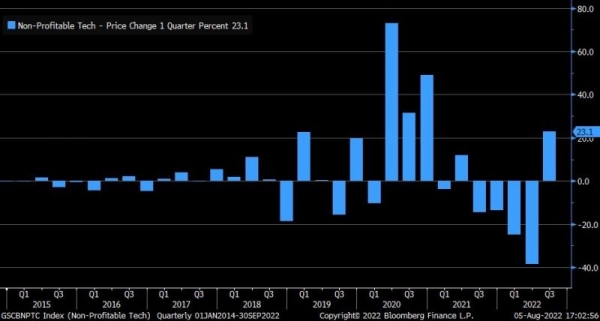
Chart#2 - The come-back of speculative stocks
The Nasdaq also had a good week, with the rebound from its lows now over 20%. The segment that suffered the most during the bear market was the one that outperformed last week: the so-called "non-profitables", i.e. companies at a stage of growth whose investments and current expenses exceed their turnover. This segment - which had shone during the "covid years" and which is largely represented in Ark Invest's funds - had recorded four consecutive quarters of sharp decline. But in the last few weeks, these speculative stocks have made spectacular gains. There are two explanations for this: 1) the return to the market of small holders (retail investors), who are eager to buy this type of stock; 2) the obligation for certain hedge funds to cover their short positions because of the rise.
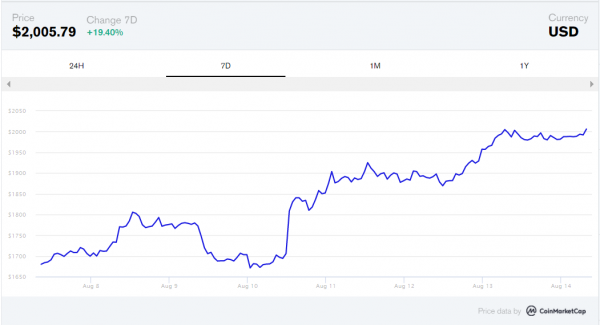
Chart#3 - Cryptocurrencies are also recovering
The rebound in crypto-currencies also continues. Bitcoin ($BTC) is testing $25,000 while Ether ($ETH) reclaimed the $2,000 level late Friday night for the first time since May, according to data from CoinMarketCap.
Ether, the second-largest crypto-currency by market capitalisation is up 17% over the week and has almost doubled in the past month. More than $152 million of "short" positions in ETH were liquidated in the past 24 hours, according to Coinglass data. Many investors are anticipating the positive impact of the upcoming Ethereum update ("The Merge"). The level of staking on the Ethereum blockchain has just reached a record high of 13.2 million ETH, according to data from Beaconscan.
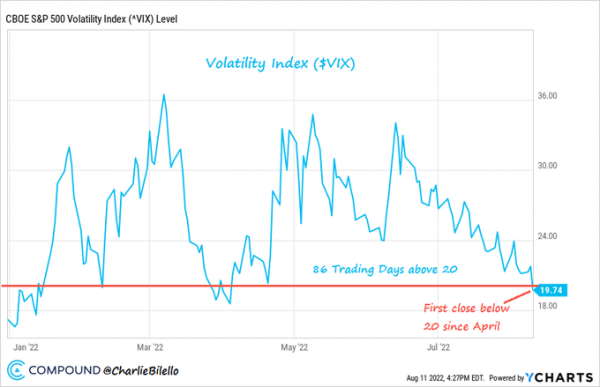
Chart#4 - Are investors too complacent?
Of course, some credit must be given to the very good market reaction to the inflation figures (see next point). Much of the bad news seems to be "priced in" and too many investors remain too defensively positioned, especially hedge funds with net short positions. They are therefore forced to cover their positions as the rally progresses, further fuelling it.
Yet many observers are probably surprised to see the VIX implied volatility index ("fear index") fall below 20 (the complacent level) for the first time since April, despite the following headwinds:
- US inflation remains near a record high (8.5%);
- A Fed monetary policy that remains restrictive;
- Downward revisions to earnings growth expectations;
- A P/E multiple for the S&P 500 that cannot be described as cheap (18x expected earnings for the next 12 months);
- The decline in ISM/PMI economic indicators;
- An energy crisis in Europe (see point #7);
- Numerous geopolitical risks: Russia/Ukraine war, China/Taiwan/USA, Brazilian elections, US mid-term elections, rising covid cases in China, etc.
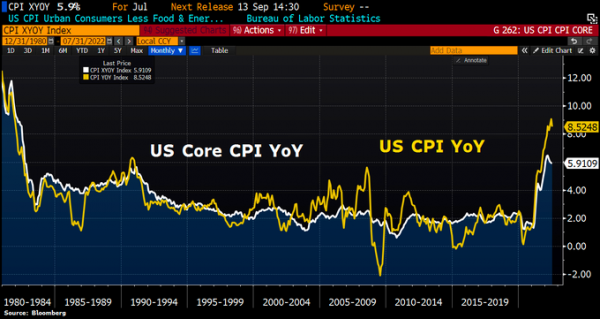
Chart#5 - First sign of inflection in 18 months for US inflation
This is THE good surprise of last week. In July, US consumer prices rose by 8.5% year-on-year and remained stable on a monthly basis. Economists were expecting increases of 8.7% and 0.2%, respectively. The Core CPI was unchanged from June at +5.9%, but lower than the +6.1% forecast.
Another positive development on the US inflation front is that the producer price index also appears to be weakening. For the month of July, it is up 9.8% year-on-year against 10.4% expected and 11.3% the previous month.
Returning to the consumer price index, it was the fall in commodity and energy prices that made this (relative) positive surprise possible. Note that the median inflation figure (i.e. the median price increase of the basket of goods and services considered for the calculation of the index) reached 6.3% year-on-year, which is higher than last month. This would suggest that inflationary pressures remain widespread, which should keep the central bank particularly vigilant.
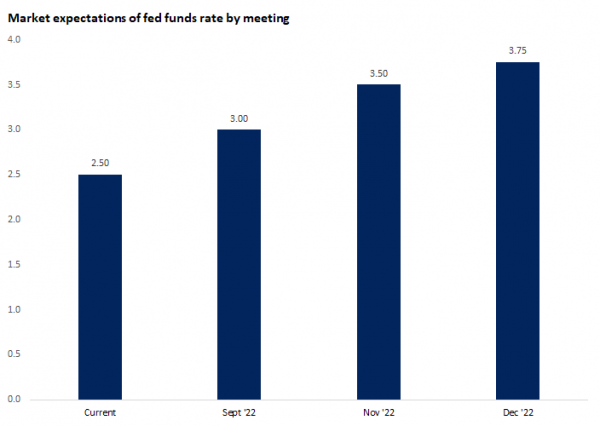
Chart#6 - Peak inflation does not necessarily mean the end of monetary tightening
Following the release of the inflation figures, the market revised the rate hike expectations downwards for the next Fed meeting. Traders are now giving a higher probability of a 50 basis point hike (instead of 75 basis points) at the September meeting. Markets expect the Fed funds rate to reach a range of 3.50% to 3.75% in 2022, before pausing in 2023.
It is worth noting that some Fed members wanted to calm the market. Thus, Mary Daly, the president of the San Francisco Fed, warns that it is "far too early to 'claim victory' in its fight against high inflation after new data showed a respite in consumer price pressures." She is not the only Fed official to do so, reflecting concerns about premature easing of financial conditions.
It is worth noting that the Fed's pace of balance sheet reduction will double in September, with the size of Quantitative Tightening (QT) increasing to $95 billion per month.
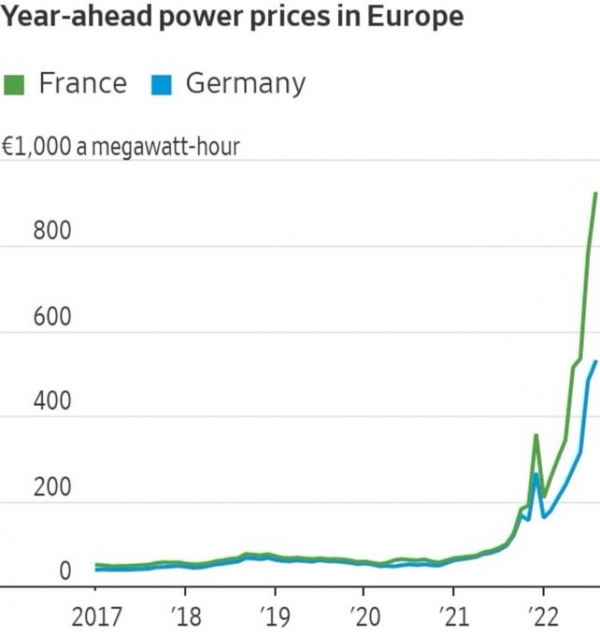
Chart#7 - The energy crisis continues in Europe
While US consumers and businesses benefited from lower energy prices in July, Europe continues to face a severe energy crisis. Electricity prices continue to rise unabated, particularly in France and Germany, increasing the risk of "stagflation" in the economy.
As Germany tries to build up its gas reserves ahead of winter, the regulator warns that Germany needs to reduce gas consumption by 20% to avoid winter rationing. Klaus Müller, head of the federal network agency, warned that the long-term cost of ending Germany's dependence on Russia would be a "very high gas price" that could have serious consequences.
Disclaimer
This marketing document has been issued by Bank Syz Ltd. It is not intended for distribution to, publication, provision or use by individuals or legal entities that are citizens of or reside in a state, country or jurisdiction in which applicable laws and regulations prohibit its distribution, publication, provision or use. It is not directed to any person or entity to whom it would be illegal to send such marketing material. This document is intended for informational purposes only and should not be construed as an offer, solicitation or recommendation for the subscription, purchase, sale or safekeeping of any security or financial instrument or for the engagement in any other transaction, as the provision of any investment advice or service, or as a contractual document. Nothing in this document constitutes an investment, legal, tax or accounting advice or a representation that any investment or strategy is suitable or appropriate for an investor's particular and individual circumstances, nor does it constitute a personalized investment advice for any investor. This document reflects the information, opinions and comments of Bank Syz Ltd. as of the date of its publication, which are subject to change without notice. The opinions and comments of the authors in this document reflect their current views and may not coincide with those of other Syz Group entities or third parties, which may have reached different conclusions. The market valuations, terms and calculations contained herein are estimates only. The information provided comes from sources deemed reliable, but Bank Syz Ltd. does not guarantee its completeness, accuracy, reliability and actuality. Past performance gives no indication of nor guarantees current or future results. Bank Syz Ltd. accepts no liability for any loss arising from the use of this document.
Related Articles
Meanwhile, the Korean stock market surges to new levels. Each week, the Syz investment team takes you through the last seven days in seven charts.
Meanwhile, bitcoin and software equities are moving like twins. Each week, the Syz investment team takes you through the last seven days in seven charts.
While gold, silver and platinum were the best performing commodities over the past year, they took a hit at the end of last week. Each week, the Syz investment team takes you through the last seven days in seven charts.


.png)
