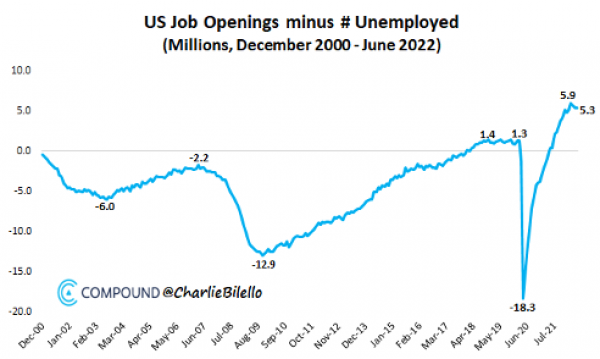
Friday's release of U.S. employment figures for the month of June was the highlight of the past week. The statistics confirmed the good health of employment in the United States. Indeed, job openings increased by 372,000 in June, exceeding consensus expectations (265,000). Average hourly earnings were also higher than expected, up 5.1% year-over-year.
The number of vacant positions currently exceeds the number of unemployed by over 5 million. In other words, labor demand remains well above supply, which should continue to put upward pressure on wages in the months ahead.
These figures suggest that the Federal Reserve will raise rates by another 75 basis points at its next meeting on July 27. U.S. bonds saw their yields rise on Friday afternoon, especially on the short end of the curve.
Chart #2
Speculative assets are leading again
Major U.S. stock indices erased much of the previous week's losses on optimism that the Fed will curb inflation without tipping the economy into a recession. The communications services, consumer discretionary and computer sectors outperformed.
But it was the more speculative segments of the market that performed led the pack. Small and mid-sized technology companies (mostly unprofitable) and the most "shorted" stocks were hit harder than the S&P 500 during the downturn. But since their mid-June lows, most speculative segments have clearly outperformed the rest of the market. There has also been a clear uptick in momentum for crypto- currencies.
Chart #3
Get ready for earnings season
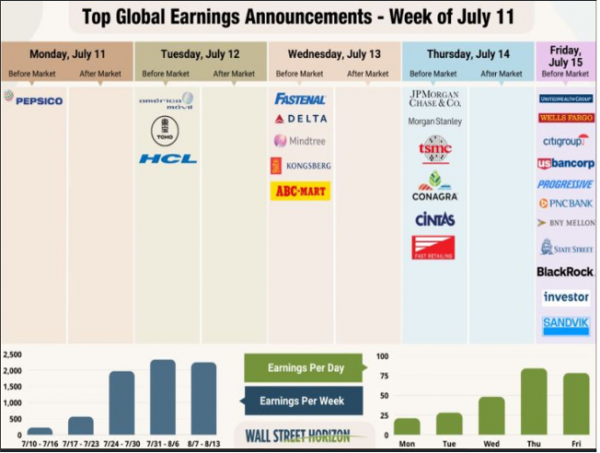
U.S. earnings growth was one of the few silver linings for equity markets in the first half of the year. Will it be the same in the coming months? Nothing is less certain, as evidenced by the downward revisions of earnings forecasts, which now outnumber the upward revisions. The earnings season that begins this week in the United States should therefore be rich in information, with the figures of some very large banks published this week.
Chart #4
Elon Musk withdraws from his Twitter takeover
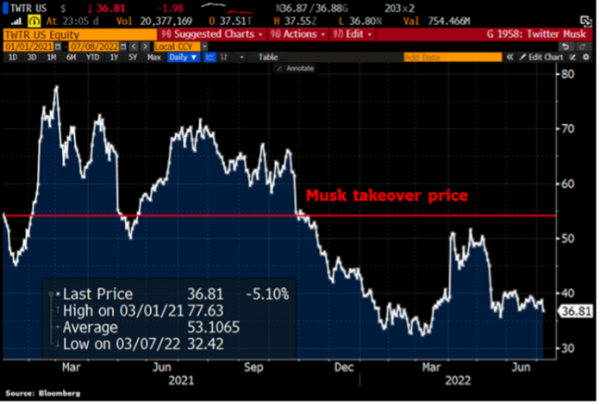
Elon Musk said he is terminating the $44 billion deal he made to acquire Twitter and take the company private, saying Twitter made "misleading statements" as part of the deal. According to Elon Musk, Twitter failed to live up to its contractual obligations regarding the issue of spam bots on the platform, he said Friday.
Following the announcement, Twitter plunged 12 percent in after-hours trading on Wall Street. Twitter plans to take legal action against Musk to enforce the original agreement, which had set the share price at $54.20...
Chart #5
The ongoing European Energy crisis
Vonovia, one of Germany's largest property owners, wants to save its tenants energy by turning down the heat in buildings overnight. When the heating season begins in the fall, tenants will only be able to turn up the temperature on their radiators between 11 p.m. and 6 a.m., the company announced Thursday.
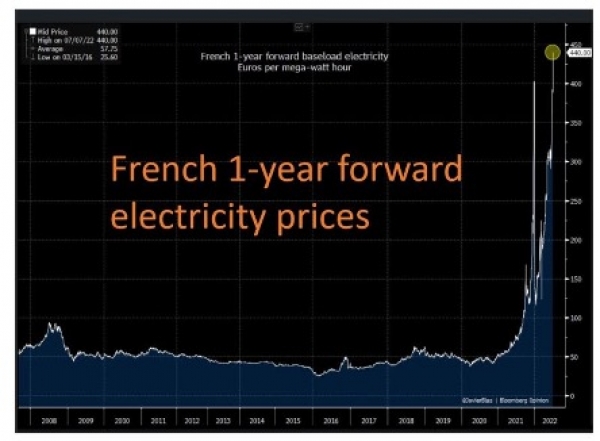
This is another development in the energy crisis currently affecting Germany. But the German electricity market is not the only one in crisis. Electricity prices in France are also soaring, as shown by the one-year electricity futures contract. The forward price is trading 675% above the 10- year average. While France is less dependent on gas than its German neighbor is, the poor performance of the French nuclear fleet partly explains this surge in electricity prices.
Chart #6
Is the euro on its way to parity with the dollar?
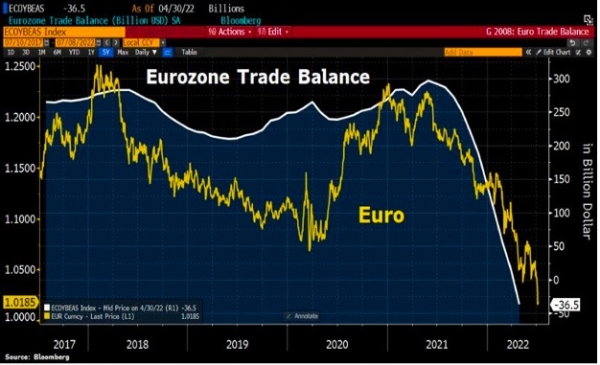
German imports from Russia are at their highest level since 2014 due to rising energy prices. Indeed, 12-month rolling imports from Russia rose to €39 billion at the end of April despite the sanctions. As a result, Germany recorded its first monthly trade deficit since 1991 in May... The foreign trade balance showed a deficit of one billion euros in May.
As a matter of fact, the trade surpluses of the entire euro zone were completely wiped out because of the energy crisis. Trade deficits were also observed in France and other countries.
One of the consequences of this crisis is the weakening of the euro against the dollar. The single currency has just broken an important support level and seems to be heading towards parity against the dollar. The euro is trading at its lowest level in 20 years, down 26% from its 2020 highs.
Chart #7
After Sri Lanka's default, who will be next?
Sri Lanka's President Gotabaya Rajapaksa fled his official residence in Colombo on Saturday morning, minutes before it was stormed by thousands of angry protesters.
The island nation has been suffering from an unprecedented shortage of basic necessities such as energy, medicine and food for several months. Its 22 million inhabitants have been facing galloping inflation and prolonged power cuts for several months. The country, in default for the first time in its history, had been preparing its population for austerity measures since last spring in order to obtain assistance from the International Monetary Fund (IMF). An economic crisis that quickly turned into a social and political crisis.
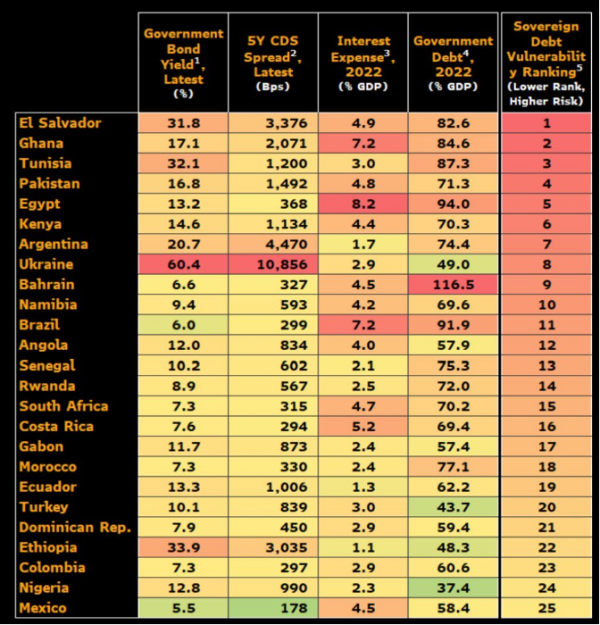
This type of crisis could soon occur in other emerging countries. As the graph below shows, many emerging countries are currently facing a tense financial situation.
Which are the most vulnerable countries? Based on a number of financial ratios (government bond yields, 5-year CDS spreads, interest expense and government debt), countries like El Salvador, Ghana, Tunisia and Pakistan seem the most vulnerable.
Disclaimer
This marketing document has been issued by Bank Syz Ltd. It is not intended for distribution to, publication, provision or use by individuals or legal entities that are citizens of or reside in a state, country or jurisdiction in which applicable laws and regulations prohibit its distribution, publication, provision or use. It is not directed to any person or entity to whom it would be illegal to send such marketing material. This document is intended for informational purposes only and should not be construed as an offer, solicitation or recommendation for the subscription, purchase, sale or safekeeping of any security or financial instrument or for the engagement in any other transaction, as the provision of any investment advice or service, or as a contractual document. Nothing in this document constitutes an investment, legal, tax or accounting advice or a representation that any investment or strategy is suitable or appropriate for an investor's particular and individual circumstances, nor does it constitute a personalized investment advice for any investor. This document reflects the information, opinions and comments of Bank Syz Ltd. as of the date of its publication, which are subject to change without notice. The opinions and comments of the authors in this document reflect their current views and may not coincide with those of other Syz Group entities or third parties, which may have reached different conclusions. The market valuations, terms and calculations contained herein are estimates only. The information provided comes from sources deemed reliable, but Bank Syz Ltd. does not guarantee its completeness, accuracy, reliability and actuality. Past performance gives no indication of nor guarantees current or future results. Bank Syz Ltd. accepts no liability for any loss arising from the use of this document.
Related Articles
Meanwhile, the Korean stock market surges to new levels. Each week, the Syz investment team takes you through the last seven days in seven charts.
Meanwhile, bitcoin and software equities are moving like twins. Each week, the Syz investment team takes you through the last seven days in seven charts.
While gold, silver and platinum were the best performing commodities over the past year, they took a hit at the end of last week. Each week, the Syz investment team takes you through the last seven days in seven charts.


.png)
