

.png)
For years, the story wrote itself. Gold and silver surged as investors sought refuge from a world of monetary excess, fiscal recklessness, and eroding dollar dominance. Central banks from Beijing to Riyadh were quietly rotating out of US Treasuries and into bullion. The structural bull case for precious metals had never looked stronger.
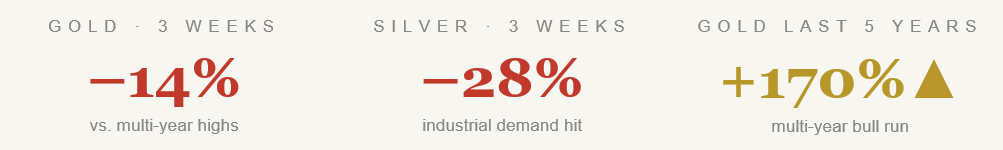
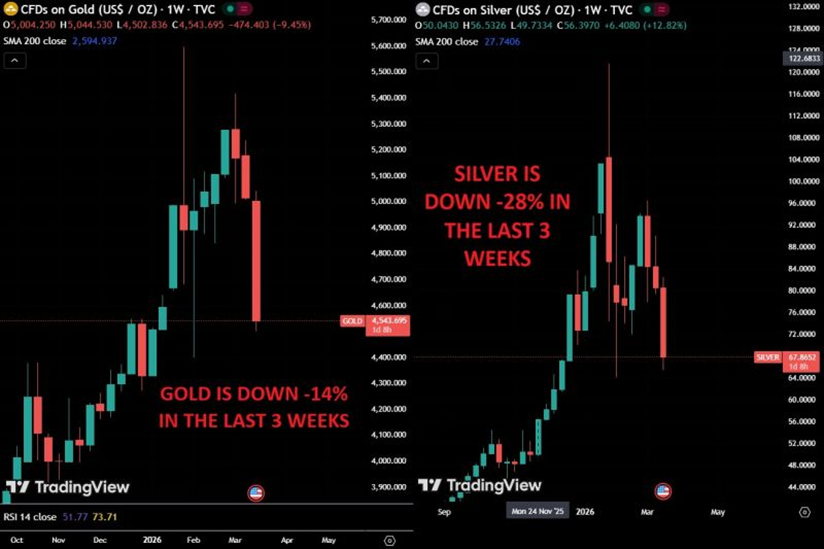
Then, in the span of three weeks, gold shed 14% of its value. Silver fell even harder—down 28%. On the surface, the timing makes no sense. The world is at war. Oil markets are in shock. Volatility is surging. Yes, the dollar has ss been strengthening, recovering from multi-year lows. Still, this should be precious metals' finest hour. Instead, they are cratering.
The explanation, when it comes into focus, is both counterintuitive and clarifying: gold is no longer behaving like a “fear asset”. It is behaving like a reserve flow asset, and right now, those flows are reversing.
A decade of monetary debasement
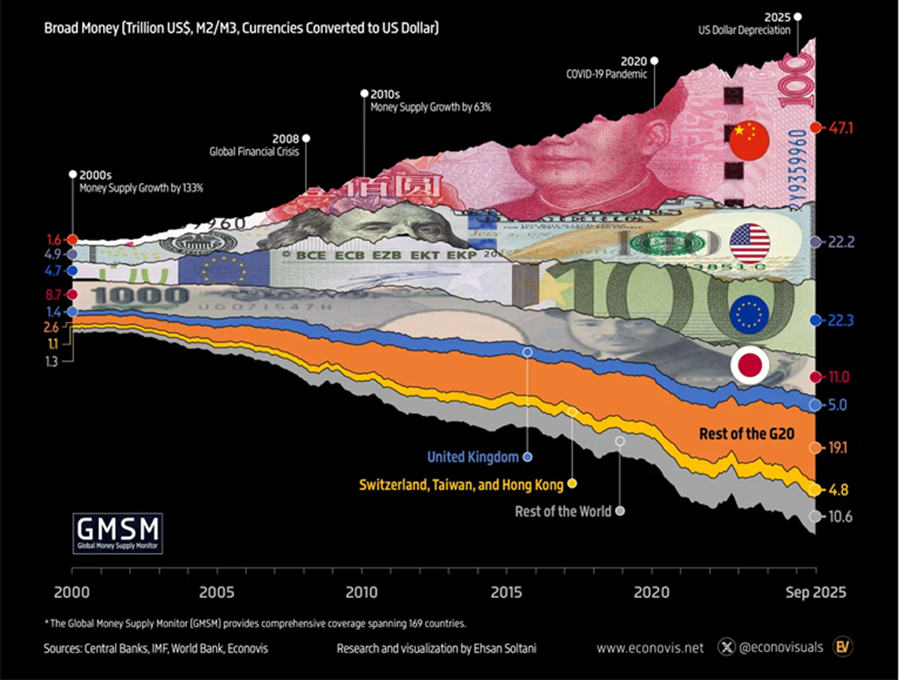
To understand why gold has been surging for years, one must first understand the two pillars that built the bull case. The first is monetary debasement. Since the 2008 financial crisis, and accelerating through the pandemic era, central banks across the developed world engaged in unprecedented balance sheet expansion. Money supply grew faster than output. Real interest rates turned negative, and inflation eventually arrived.
In this environment, hard assets—gold and silver chief among them—offered something increasingly scarce: a store of value that cannot be printed. Investors, institutional and retail alike, poured capital into precious metals as a hedge against the slow erosion of purchasing power. The logic was simple and compelling: if fiat currencies are being debased, own assets that aren't.
"Gold became a reserve asset of choice, not merely a safe haven—a structural shift that transformed who was buying and why."
The second pillar was de-dollarisation. The weaponisation of the US dollar in 2022—when Washington and Brussels froze Russia's foreign reserves—sent a chill through every surplus nation on earth. The message was stark: dollar-denominated assets, including Treasuries, could be seized. Gold could not.
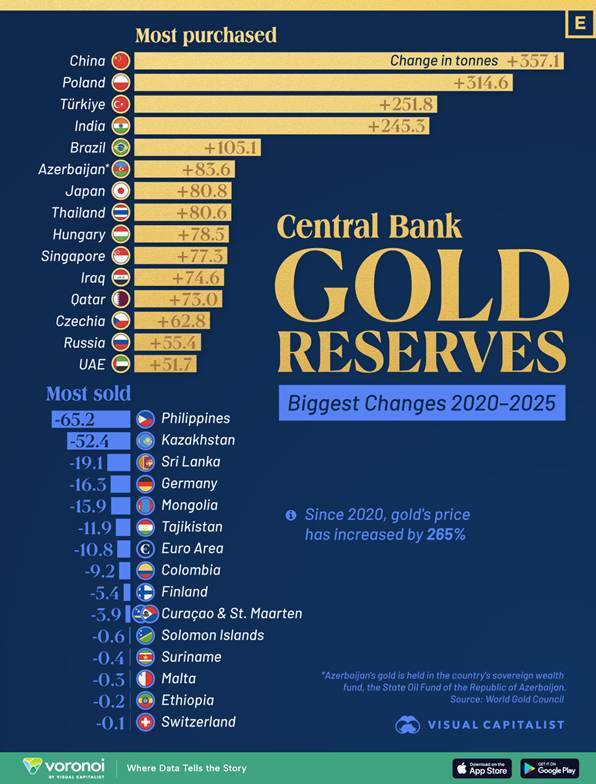
The response was swift and historic. Central banks, particularly in the Global South and the Gulf, began accumulating gold at a pace not seen in decades. Saudi Arabia, the UAE, Kuwait, and China all became significant buyers. This was not speculative demand. It was sovereign wealth management—a structural reallocation away from dollar dependence and toward an asset that is no one's liability.
Enter the Hormuz shock
The Iran conflict, and particularly the blockade of the Strait of Hormuz, has upended this dynamic with brutal efficiency. The strait is the jugular of the global oil market, with roughly 20% of the world's petroleum passes through it daily. A blockade does not merely raise oil prices; it chokes the revenue streams of the very nations that had become gold's most reliable marginal buyers.
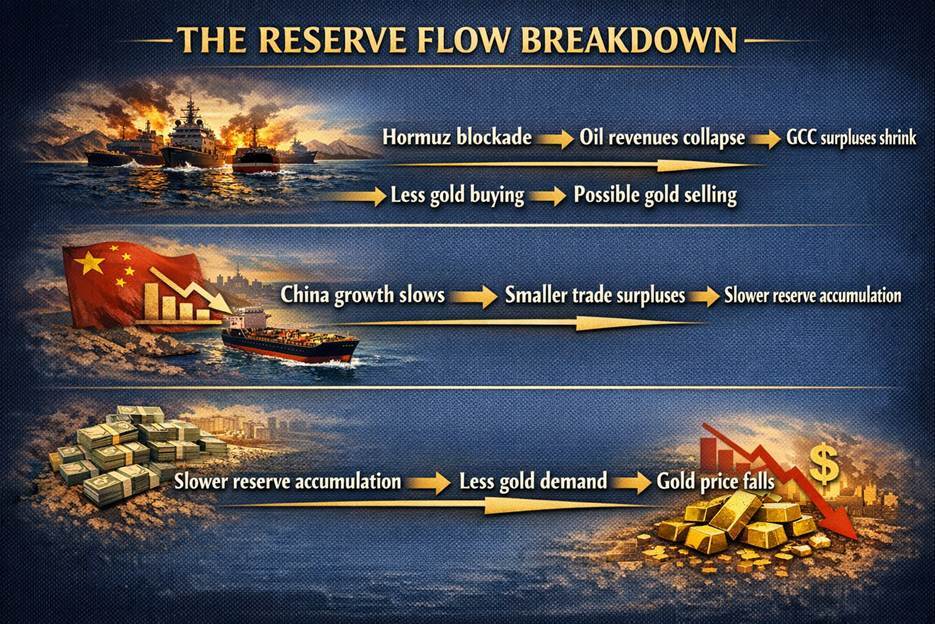
Saudi Arabia, the UAE, and Kuwait run their sovereign wealth funds and reserve portfolios on the back of petrodollar surpluses. When oil revenues contract sharply—as they do when a major shipping artery is disrupted—those surpluses narrow or disappear. The result: the marginal buyer of gold becomes a non-buyer, or worse, a seller forced to liquidate positions to meet domestic fiscal obligations.
China adds a further complication. The world's largest oil importer is now facing a significant terms-of-trade shock. Slower growth means smaller trade surpluses. Smaller surpluses mean a slower pace of reserve accumulation, and slower reserve accumulation means less demand for the asset that has served as the alternative reserve currency of choice.
Why silver is falling harder
Silver's decline has been nearly twice as severe as gold's, and the reason comes down to its dual identity. Where gold is primarily a monetary and reserve asset, silver straddles two worlds. Approximately half of all silver demand is industrial—electronics, solar panels, electric vehicles, semiconductors.
When global growth expectations deteriorate rapidly, this industrial demand evaporates faster than any monetary or safe-haven premium can compensate for. Silver is hit from both sides simultaneously: weaker reserve accumulation and weaker industrial demand. The same growth shock that reduces GCC surpluses also slows the manufacturing activity that consumes silver.
The paradox of geopolitical precious metals
The conventional wisdom—that gold thrives in times of war and geopolitical stress—is not wrong so much as it is incomplete. Gold performs well in a specific type of crisis: one in which investors flee to safety and liquidity flows toward the perceived shelter of hard assets. But the Iran conflict is generating a different kind of crisis, one that disrupts the very plumbing of the global capital flows that have underpinned the gold bull market.
This is the paradox at the heart of the current move. Gold is not reacting to the headlines. It is reacting to the balance sheets—specifically, to the weakening of the sovereign balance sheets that have been gold's most consequential buyers. Fear is present in abundance. But fear, in this instance, is not the variable that drives prices.
"In the short term, gold follows liquidity and reserves—not headlines and fear. The structural bull case remains intact; the marginal buyer has simply stepped away."
Momentum, retail, and the chase
Before the conflict reshaped the picture, precious metals had become something else entirely: momentum trades. The structural narrative of debasement, de-dollarisation, sovereign buying was real and well-founded, but it had also attracted a second, fickler wave of capital. Retail investors, drawn in by months of relentless price appreciation and amplified by social media, ETF inflows, and zero-commission brokerages, piled into gold and silver funds at a pace not seen in years. Gold ETFs recorded some of their largest weekly inflows on record in the months preceding the conflict. Silver, with its lower price per ounce and higher volatility, became a particular favourite among momentum-driven retail traders chasing outsized returns.
This matters for understanding the severity of the current selloff. When an asset's price embeds not just structural demand but also a momentum premium—the extra bid that comes from trend-followers and late retail money—the unwind, when it comes, is brutal. As shown on the chart below, the Gold Trust ETF just recorded its largest monthly outflow since April 2013.
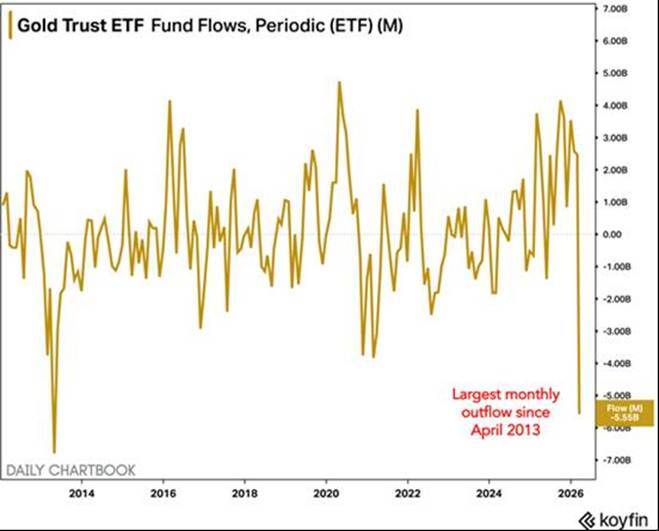
The same investors who bought on the way up have stop-losses, margin calls, and short attention spans. As prices began turning, the momentum crowd exited as quickly as it had entered, amplifying the drawdown well beyond what fundamentals alone would have dictated. The Hormuz shock may have been the trigger, but the fuel for the fire was the froth that had accumulated during the rally.
Source: Bloomberg
Outlook
The structural case endures—for now
None of this invalidates the long-term thesis for gold. Monetary debasement has not been reversed. De-dollarization is a multi-decade process, not a quarterly trade. Central banks will not abandon their gold accumulation strategies because of a temporary revenue shortfall. When the dust settles—oil flows normalise, China stabilises, GCC surpluses recover—the structural bid for gold will reassert itself.
But markets do not trade on multi-decade theses in the short run. They trade on who is buying and who is selling today. Right now, the most important buyers are under financial pressure. That, more than any geopolitical narrative, explains why gold is falling in a world that seems tailor-made for it to rise.
For investors, the lesson is both sobering and clarifying: understanding what drives an asset in the long run does not always tell you what it will do in the next month. Gold is still sound money. But even sound money moves with the tides of global liquidity—and for now, the tide is going out.