Charles-Henry Monchau

Chief Investment Officer

Chart #1 — 

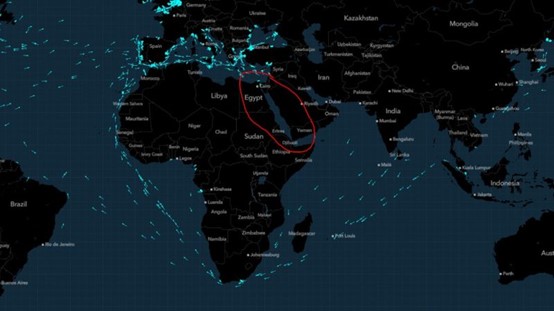
Houthi attacks in the Red Sea cause maritime freight prices to soar

More than two weeks after the launch of the US-led Operation Prosperity Guardian, the Houthis are still laying down the law in the Red Sea. And carriers no longer want to take any risks in this area. Container ships heading for Europe and/or North America almost all avoid the Red Sea (see in red on the map below) and make very long detours, which are inevitably much more expensive.
As a result, container shipping rates have rocketed, rising by an average of almost 90% in the space of 2 weeks, and even more for some destinations. For example, shipping a 40-foot container from Asia to Northern Europe now costs more than $4,000, an increase of 173%. To date, it is estimated that carriers have diverted some $200 billion worth of trade from the Red Sea due to threats from Houthi militants.
Supply chain issues are thus back on the agenda. Did we celebrate the end of inflation too soon?

W7C_240108_i01

Source: Javier Blas


Chart #2 — 

Historically, US equities struggle in the first quarter of the election year

After a fireworks finale to 2023, US equities are struggling at the start of the year. History shows that the first quarter is mediocre in terms of performance in a presidential election year. Indeed, investors tend to be nervous in the first few months of the year because of the uncertainty surrounding the name of the next occupant of the White House. Historically, optimism tends to return around June. This is followed by another period of volatility in the two months leading up to the election. 

W7C_240108_i02

Source: Trendspider


Chart #3 — 

US job market remains solid

In December, the US economy created 216,000 jobs, more than the 170,000 expected. This means that the US economy has created jobs for 36 consecutive months. The unemployment rate remained stable at 3.7% in December (the consensus estimate was for an increase to 3.8%). Wages rose by 4.1% year-on-year, compared with 4% in November.
The market's reaction was as expected: bond yields rose and the market revised downwards the number of rate cuts planned for 2024.

W7C_240108_i03

Source:  Bloomberg


Chart #4 — 

US debt reaches the $34 trillion mark

Last week, total US debt reached $34 trillion for the first time in its history, representing a 100% increase in less than 10 years. Since the end of the debt ceiling 'crisis' in June 2023, total US debt has risen by almost $3 trillion. The amount of US debt is now greater than the value of the economies of China, Germany, Japan, India and the UK COMBINED. The US currently spends $2 billion PER DAY on interest costs alone. Debt per capita is a record $101,000.

W7C_240108_i04


Chart #5 — 

China and Russia turn away from US Treasuries in favour of the yellow metal

At a time when US debt and the cost of debt are exploding, the graph below is not necessarily a source of joy for Uncle Sam. China and Russia are continuing to offload their US Treasuries and are accumulating gold. This arbitrage comes at the worst possible time for the United States.

W7C_240108_i05

Source: www.zerohedge.com, Bloomberg


Chart #6 — 

The BRICS have just doubled
in size

Last week, the United Arab Emirates, Saudi Arabia, Ethiopia, Egypt and Iran officially became members of the BRICS. Together with Brazil, Russia, India, China and South Africa, they form a formidable economic powerhouse, accounting for 29% of global GDP and 43% of global oil production. Although there are tensions between member states such as China and India, or Saudi Arabia and Iran, the BRICS represent a growing challenge for the G7. Statement by Chinese President Xi: "I would like to extend a warm welcome to the leaders of the new BRICS members".

W7C_240108_i06


Chart #7 — 

Watchmaking: Luxury watch prices have collapsed on the secondary market

The WatchCharts market index tracks price trends on the secondary watch market. It is made up of 60 watch models from the top 10 luxury brands, which are sorted and weighted according to transaction value (the index tracks the price of these watches in USD over time. It is rebalanced every year on 1 January).
After rising sharply between the Covid-19 pandemic and the beginning of 2022, this index has fallen by more than 35% in less than 2 years.
A case in point is this Rolex model: its price on the secondary market has fallen from almost $45,000 in the summer of 2022 to $18,400 today at the end of 2023, a drop of almost 60%...

W7C_240108_i07


Disclaimer

This marketing document has been issued by Bank Syz Ltd. It is not intended for distribution to, publication, provision or use by individuals or legal entities that are citizens of or reside in a state, country or jurisdiction in which applicable laws and regulations prohibit its distribution, publication, provision or use. It is not directed to any person or entity to whom it would be illegal to send such marketing material. This document is intended for informational purposes only and should not be construed as an offer, solicitation or recommendation for the subscription, purchase, sale or safekeeping of any security or financial instrument or for the engagement in any other transaction, as the provision of any investment advice or service, or as a contractual document. Nothing in this document constitutes an investment, legal, tax or accounting advice or a representation that any investment or strategy is suitable or appropriate for an investor's particular and individual circumstances, nor does it constitute a personalized investment advice for any investor. This document reflects the information, opinions and comments of Bank Syz Ltd. as of the date of its publication, which are subject to change without notice. The opinions and comments of the authors in this document reflect their current views and may not coincide with those of other Syz Group entities or third parties, which may have reached different conclusions. The market valuations, terms and calculations contained herein are estimates only. The information provided comes from sources deemed reliable, but Bank Syz Ltd. does not guarantee its completeness, accuracy, reliability and actuality. Past performance gives no indication of nor guarantees current or future results. Bank Syz Ltd. accepts no liability for any loss arising from the use of this document.

Read More

Straight from the Desk

Syz the moment

Live feeds, charts, breaking stories, all day long.

Thinking out loud

Sign up for our weekly email highlighting the most popular posts.

Follow us

Thinking out loud

Investing with intelligence

Our latest research, commentary and market outlooks