Charles-Henry Monchau

Chief Investment Officer

Chart #1 — 

Nvidia blows away market expectations

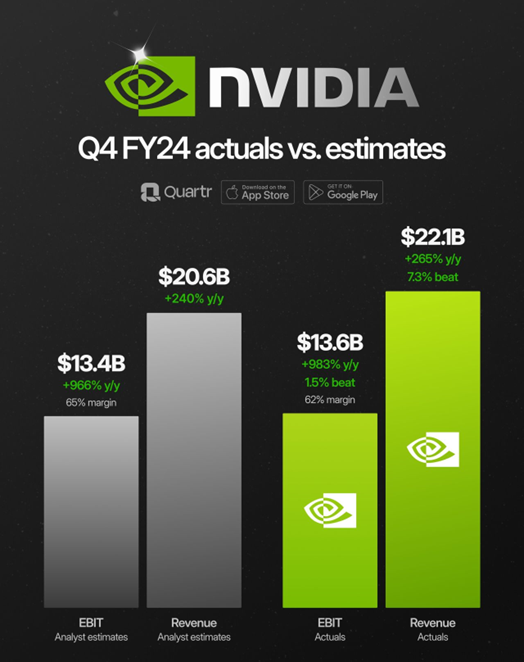
For most investors, it was the most eagerly awaited event of the week. On Wednesday, semiconductor giant Nvidia published its results for the 4th quarter of its 2024 fiscal year. And despite very high expectations, they were even better than expected.

Sales rose by 22% sequentially, reaching $22.1 billion for the quarter, $1.6 billion better than expected. Gross margin was 76%, 2 points better than the previous quarter. Operating margin is now 62%, 4 points better than in Q3. Earnings per share were $5.16, 52 cents better than expected.

Nvidia stated that demand for its products continues to far outstrip supply. According to executives, conditions are excellent and should enable continued growth through to 2025. Nvidia spent $9.2 billion in cash flow on share buybacks. Data centre sales of $18.4 billion set a new record and exceeded expectations.

Source: Quartr


Chart #2 — 

Thursday was a record day for Nvidia and Wall Street

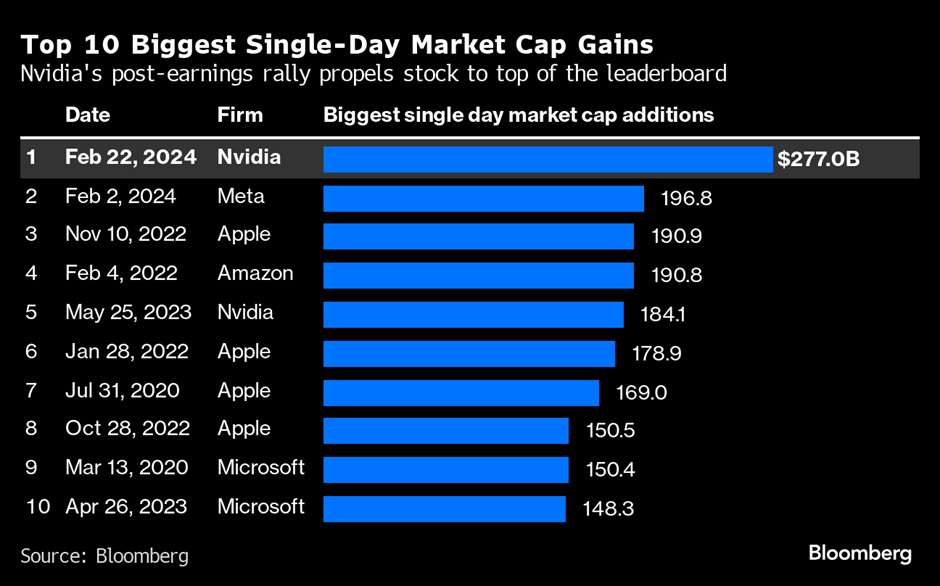
Nvidia's exceptional results boosted investor morale. Nvidia shares rose by almost $277 billion in market capitalisation in a single day. This is the biggest daily increase in market capitalisation in the history of the stock markets. To put this figure in perspective, it's the equivalent of two Goldman Sachs, half a JP Morgan or a Netflix.

The previous daily advance record was set by Meta just 20 days ago (following the publication of its quarterly results). Nvidia is now just 5% away from becoming the third-largest US company, with a market capitalisation of over $2,000 billion.

The Magnificent 7 increased their market capitalisation by over $500 billion on Thursday to set a new record. In the process, the Nasdaq, S&P 500 and Dow Jones all hit new all-time highs that day.


Source: Bloomberg 


Chart #3 — 

Are the magnificent 7 too expensive?


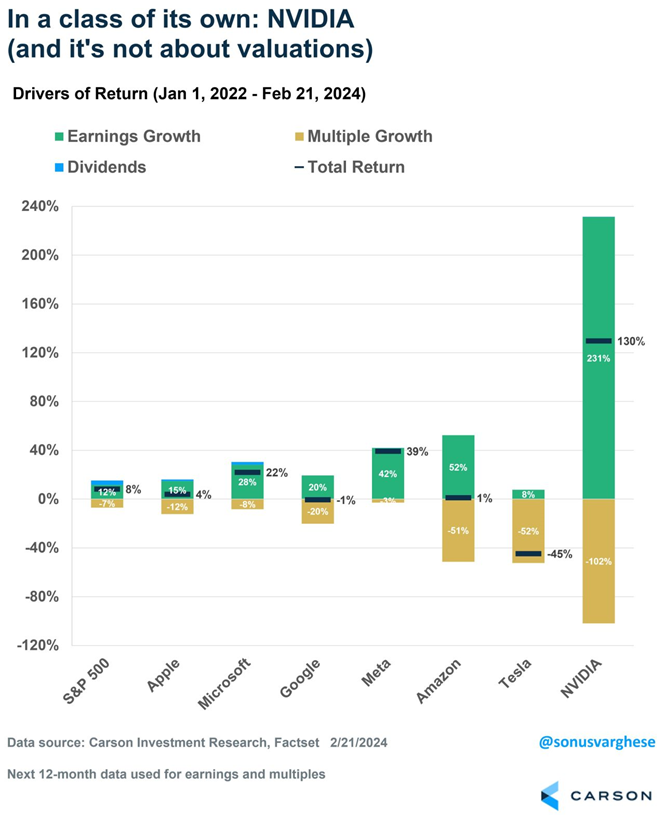
We don't dispute the fact that the magnificent 7 are trading at very attractive valuation multiples. But as Sonus Varghese's chart (see below) demonstrates, the fundamentals seem to justify - at least in part - the meteoric rise of the big tech caps.

Since 2021, NVDA shares have risen by 130%, while earnings have increased by 231%. And the other Mag 7 names are following a similar trajectory.

Source: Carson, Ryan Detrick


Chart #4 — 

Nasdaq little affected by downward revisions to 2024 rate cut expectations


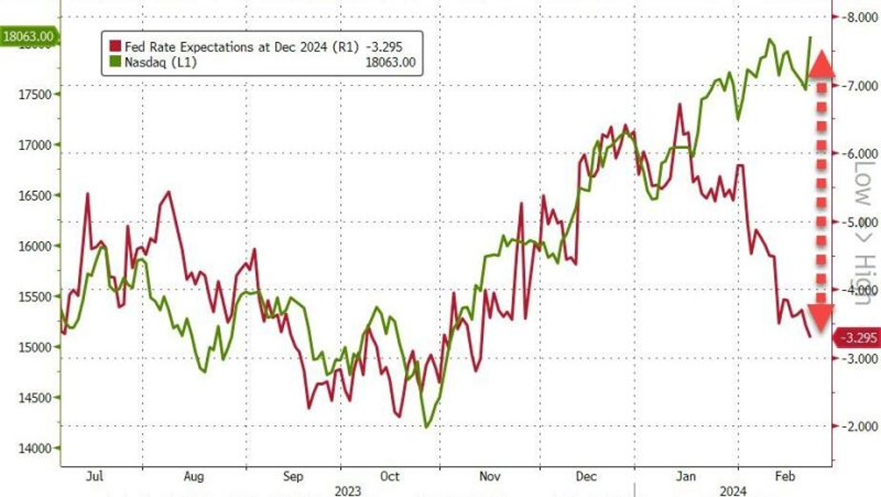
Equity markets don't seem to be concerned about the future path of US interest rates. The Nasdaq (green line) continues to rise, while forecasts of rate cuts (red line) are falling. Will the gap finally be closed?

Note that market expectations, in terms of rate cuts, are now as follows:

Probability of a rate cut in March: 5% (it was 80% at the start of the year).

Probability of a cut in May: 29% (vs. 100%).

Probability of a rate cut in June: 67% (vs. 100%).


Source: Bloomberg, www.zerohedge.com


Chart #5 — 

A new record for the Nikkei 225 index


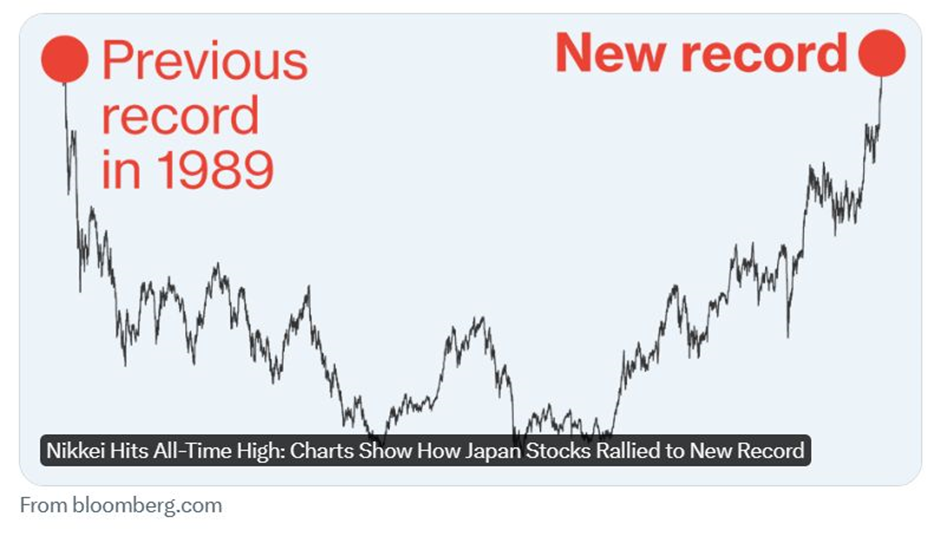
In the shadow of the S&P 500 and artificial intelligence stocks, the Japanese equity market is making headway. On Thursday morning, the Nikkei 225 reached a level not seen since 1989, marking a comeback for the Japanese stock market.

The Nikkei 225 reached an all-time high of 38,924.88 points, as strong corporate earnings, and measures to boost investor returns fuelled a strong advance in Japanese equities over the past few months.

The Nikkei and Topix are currently the best-performing indices in the Asia-Pacific region, with a gain of over 10% in 2024. As a reminder, they had risen by over 25% in 2023.

One caveat, however: all these figures are expressed in local currency. For example, the Nikkei 225 in Swiss francs remains 50% below all-time highs.

Source: Bloomberg


Chart #6 — 

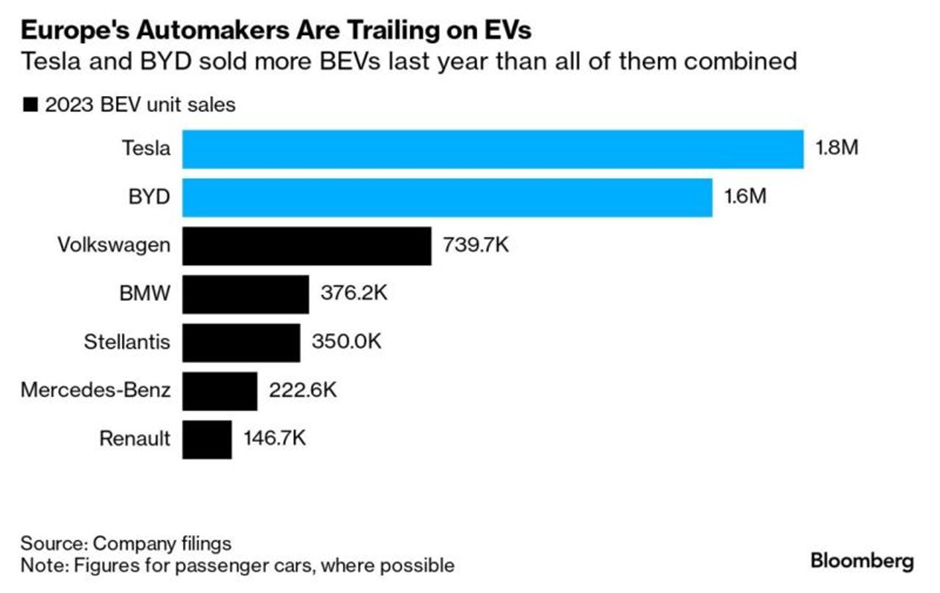
Electric car production - Europe is lagging

European companies have been active in the automotive sector for decades. Yet they are now well behind of Tesla and China's BYD in terms of electric car sales. Why are they so slow to adapt to the new reality?

Source: Bloomberg 


Chart #7 — 

Don’t stop investing!

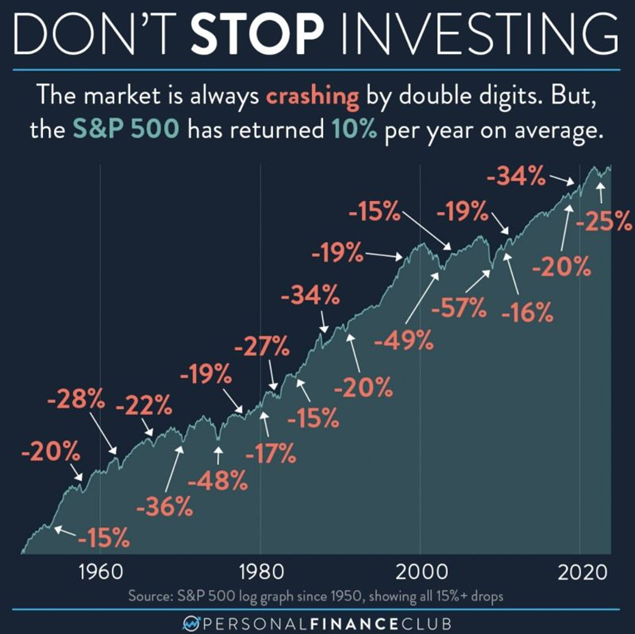
The chart below shows the progression of the S&P 500 index since 1950. The y-axis has been removed, but the graph shows that a dollar invested in the S&P 500 is now worth over $1,000.

Despite the many corrections and crashes of the S&P 500 over this period, investors who have remained invested (and continued to invest) have been more than rewarded over this window of time.


Source: Personal Finance Club


Disclaimer

This marketing document has been issued by Bank Syz Ltd. It is not intended for distribution to, publication, provision or use by individuals or legal entities that are citizens of or reside in a state, country or jurisdiction in which applicable laws and regulations prohibit its distribution, publication, provision or use. It is not directed to any person or entity to whom it would be illegal to send such marketing material. This document is intended for informational purposes only and should not be construed as an offer, solicitation or recommendation for the subscription, purchase, sale or safekeeping of any security or financial instrument or for the engagement in any other transaction, as the provision of any investment advice or service, or as a contractual document. Nothing in this document constitutes an investment, legal, tax or accounting advice or a representation that any investment or strategy is suitable or appropriate for an investor's particular and individual circumstances, nor does it constitute a personalized investment advice for any investor. This document reflects the information, opinions and comments of Bank Syz Ltd. as of the date of its publication, which are subject to change without notice. The opinions and comments of the authors in this document reflect their current views and may not coincide with those of other Syz Group entities or third parties, which may have reached different conclusions. The market valuations, terms and calculations contained herein are estimates only. The information provided comes from sources deemed reliable, but Bank Syz Ltd. does not guarantee its completeness, accuracy, reliability and actuality. Past performance gives no indication of nor guarantees current or future results. Bank Syz Ltd. accepts no liability for any loss arising from the use of this document.
Read More

Straight from the Desk

Syz the moment

Live feeds, charts, breaking stories, all day long.

Thinking out loud

Sign up for our weekly email highlighting the most popular posts.

Follow us

Thinking out loud

Investing with intelligence

Our latest research, commentary and market outlooks