
.png)
Source: Bank of America
We are sorry that for legal reasons we are not able to help US citizens or Canadian residents other than in Ontario, Quebec, or Alberta. Best wishes for the future…
We are sorry that for legal reasons we are not able to help US citizens or Canadian residents other than in Ontario, Quebec, or Alberta. Best wishes for the future…
You chose the following profile. If you made a mistake, please change here USA
This marketing document has been issued by Bank Syz Ltd. It is not intended for distribution to, publication, provision or use by individuals or legal entities that are citizens of or reside in a state, country or jurisdiction in which applicable laws and regulations prohibit its distribution, publication, provision or use. It is not directed to any person or entity to whom it would be illegal to send such marketing material.
This document is intended for informational purposes only and should not be construed as an offer, solicitation or recommendation for the subscription, purchase, sale or safekeeping of any security or financial instrument or for the engagement in any other transaction, as the provision of any investment advice or service, or as a contractual document. Nothing in this document constitutes an investment, legal, tax or accounting advice or a representation that any investment or strategy is suitable or appropriate for an investor's particular and individual circumstances, nor does it constitute a personalized investment advice for any investor.
This document reflects the information, opinions and comments of Bank Syz Ltd. as of the date of its publication, which are subject to change without notice. The opinions and comments of the authors in this document reflect their current views and may not coincide with those of other
Syz Group entities or third parties, which may have reached different conclusions. The market valuations, terms and calculations contained herein are estimates only. The information provided comes from sources deemed reliable, but Bank Syz Ltd. does not guarantee its completeness, accuracy, reliability and actuality. Past performance gives no indication of nor guarantees current or future results. Bank Syz Ltd. accepts no liability for any loss arising from the use of this document.

Charles-Henry Monchau
Chief Investment Officer
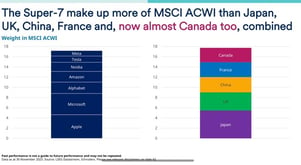
The market capitalization of the "Magnificent 7" (Apple, Microsoft, Alphabet, Amazon, Nvidia, Tesla and Meta/Facebook) is now greater than that of the French, Chinese, British, Japanese and Canadian equity markets combined... The dominance of such a small number of stocks is a risk that investors should not overlook as they enter a new stock market year.
Source: Bank of America
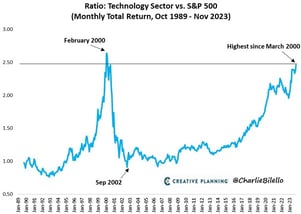
The dominance of the magnificent 7 is logically reflected in their stock market performance. As the chart below shows, the outperformance of the technology sector, relative to the rest of the S&P 500 index, has reached its highest level since March 2000, a date which corresponds to the peak of the dotcom bubble.
Source: Charlie Bilello
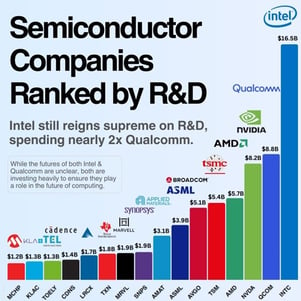
High R&D (research & development) spending does not guarantee earnings growth and/or strong stock market performance for shareholders. The chart below, produced by AI & Tech Investing, shows semiconductor companies ranked according to their R&D spending over the past 12 months. Intel, Qualcomm, Nvidia, AMD and Taiwan Semiconductors top the list.
Intel has spent over $100 billion on R&D over the past decade. Despite this, the stock has posted the second-lowest stock market performance in the semiconductor universe over this period. The same is true when it comes to sales trends: Intel generated $52.9 billion in revenues over the last twelve months. Ten years ago, Intel's sales amounted to... 52.4 billion dollars.
Source: Eric | AI & Tech Investing
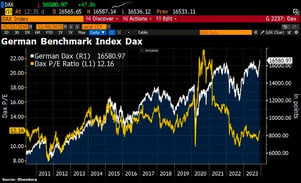
The DAX index reached an all-time high last week. It's worth noting that most of the DAX's rise this year is due to higher expectations for earnings growth, not to an increase in the price/earnings ratio. The Dax has gained 18% since the start of the year, while the price/earnings ratio of the DAX index has risen by just 6%, from 11.5x to 12.2x.
Source: Bloomberg, HolgerZ
The Indian stock market reached an important milestone last week. Its market capitalization is now $4,000 billion, the 5th largest in the world.
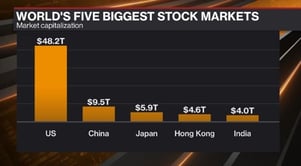
Source: David Ingles, Bloomberg
The table below shows what the markets are currently anticipating as regards the first rate cuts by the major central banks. The consensus is for the European and Canadian central banks to cut their key rates as early as April. The U.S. Federal Reserve is expected to follow in May, while the SNB and the Bank of England will not start cutting rates until June.
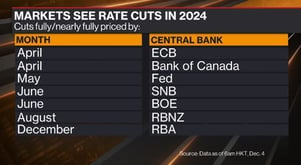
Source: : Bloomberg, David Ingles
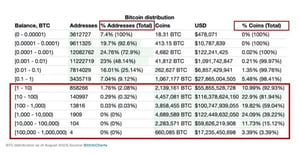
Bitcoin has a wealth concentration problem. As the chart below shows, 2.08% of bitcoin holders (based on listed addresses) own almost 93% of the digital tokens currently in circulation.
What will happen if several spot bitcoin ETFs are approved and large asset managers have to source bitcoins in a hurry to keep up with demand? What will be the effect on the BTC price if very few of the holders categorized in the aforementioned 2.08% do not wish to sell their bitcoin?
Some analysts believe that this picture is misleading. For example, Glassnode has pointed out that it does not take into account the fact that a single address can be used by several bitcoin holders, that many digital tokens have been lost and that many bitcoins are "packaged" in other tokens. By adjusting these figures, we could arrive at less than 50% concentration for the top 2% of addresses, which is still a high figure, but well below the current distribution of wealth in the world.
These figures do, however, raise the question of the mismatch between supply and demand for bitcoin, and the shock that could ensue the day several bitcoin cash ETFs are approved. Indeed, in the event of strong demand for these ETFs, asset managers would become "forced" buyers of an asset whose supply is relatively scarce. It is possible, however, that some "whales" (the largest holders of bitcoins) will take advantage of rising demand and prices to offload some of the BTC they have accumulated over the past few years. Time will tell.
Source: BitInfoCharts
This marketing document has been issued by Bank Syz Ltd. It is not intended for distribution to, publication, provision or use by individuals or legal entities that are citizens of or reside in a state, country or jurisdiction in which applicable laws and regulations prohibit its distribution, publication, provision or use. It is not directed to any person or entity to whom it would be illegal to send such marketing material. This document is intended for informational purposes only and should not be construed as an offer, solicitation or recommendation for the subscription, purchase, sale or safekeeping of any security or financial instrument or for the engagement in any other transaction, as the provision of any investment advice or service, or as a contractual document. Nothing in this document constitutes an investment, legal, tax or accounting advice or a representation that any investment or strategy is suitable or appropriate for an investor's particular and individual circumstances, nor does it constitute a personalized investment advice for any investor. This document reflects the information, opinions and comments of Bank Syz Ltd. as of the date of its publication, which are subject to change without notice. The opinions and comments of the authors in this document reflect their current views and may not coincide with those of other Syz Group entities or third parties, which may have reached different conclusions. The market valuations, terms and calculations contained herein are estimates only. The information provided comes from sources deemed reliable, but Bank Syz Ltd. does not guarantee its completeness, accuracy, reliability and actuality. Past performance gives no indication of nor guarantees current or future results. Bank Syz Ltd. accepts no liability for any loss arising from the use of this document.
Meanwhile, Wall Street's long-term earnings expectations for the S&P 500 are now at record levels. Each week, the Syz investment team takes you through the last seven days in seven charts.
Meanwhile, corporate leadership is evolving rapidly: only 135 of the S&P 500 constituents from 1996 are still in the index today, while the EU goods trade deficit with China is close to a record €376bn. Each week, the Syz investment team takes you through the last seven days in seven charts.
Meanwhile, Trump’s personal crypto earnings in 2025 topped the combined profits of every publicly listed US crypto company. Each week, the Syz investment team takes you through the last seven days in seven charts.
Live feeds, charts, breaking stories, all day long.
Our latest research, commentary and market outlooks