Charles-Henry Monchau

Chief Investment Officer

Chart #1 — 

The come-back of stagflation fears


This chart alone explains why market sentiment has deteriorated throughout the 4th quarter: global economic growth forecasts are down, while inflation forecasts are up. After the very clear deflationary trend seen in the 1st half of the year, the specter of stagflation is once again looming, weighing on investor morale.

Syz-Feature_QR10charts_231005_i02


Chart #2  — 

US debt and debt servicing costs are sky rocketing

Fears of another US Federal government shutdown also weighed on market sentiment towards the end of the quarter. After repeated attempts to pass legislation averting a government shutdown, Rep House Speaker Kevin McCarthy changed the plan during the last weekend of the quarter, reversing his previous opposition to a bipartisan package and putting forward a last-minute, six-week continuation of current spending levels. The House passed the measure with a vote of 335-91, including 200 Democrats carrying the vote. The same day, the legislation went to the Senate which passed the measure and President Joe Biden signed the spending bill into law, preventing a government shutdown. Rep House Speaker Kevin McCarthy was ousted from the House a few days after.
This resolution implies that for the next 45 days or so, the US government will NOT be shut down. However, this stopgap bill is only a temporary solution. Decision makers are just “kicking the can down the road another time”. Indeed, the House and Senate are both struggling to approve yearlong spending bills, and the gulf between the two parties remains vast. And there is no long-term plan.

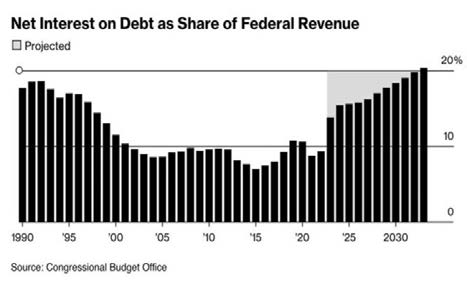
For nearly 20 years, it was effectively free for the US to issue debt as debt service costs were ~1.5%. Now, debt service costs have doubled to 3% and will rise toward 5% as rates skyrocket.

To put this in perspective, 5% on $33 trillion is ~$1.7 trillion per year on interest expense. As deficit spending rises, so are rates,  as the US issues trillions in bonds to cover the deficit. It's a never-ending cycle of borrowing to spend which is driving rates higher and leading to interest expense being 20% of US revenue.

Syz-Feature_QR10charts_231005_i03


Chart #3  — 

Disinflation trend continues

Headline inflation peaked in the second half of 2022 across large developed economies and has been slowing down since then as Good prices’ inflation (coming from supply chains’ tensions) and energy prices trended lower. The impact of those two drivers will gradually wane off from 12-month rolling inflation rates going forward. “Core” inflation has followed with a lag but has only slightly slowed down in the US and Europe for now, as Service prices’ inflation remained fuelled by firm consumer demand (especially in the US) and rising wages and labor costs. “Core” inflation is still clearly above central banks’ targets.
Leading indicators and gauges of consumer and business inflation expectations have been trending lower recently on both sides of the Atlantic.

Syz-Feature_QR10charts_231005_i04


Chart #4 — 

The Fed decides to take a pause in the rate hike cycle but leaves the door open to further monetary tightening


As expected, the US Federal Reserve decided to leave interest rates unchanged in September, keeping the benchmark rate within the target range of 5.25% to 5.5%. 12 Fed members are forecasting a further rate hike at upcoming meetings, while 7 members are no longer forecasting one. The dot plot of rate projections shows that US monetary policymakers are still expecting another rate hike this year. Also, the rate projections for 2024 and 2025 have all risen by half a percentage point, indicating that the Fed expects rates to remain higher for longer. The Fed is forecasting inflation of 2.6% in 2024. The median projection for economic growth in 2023 is raised from 1% in June to 2.1%; officials significantly cut unemployment forecasts and now expect the unemployment rate to peak at 4.1%, rather than 4.5%. It should be noted that the Fed acknowledges that job creation has "slowed» but affirms that it "remains strong".

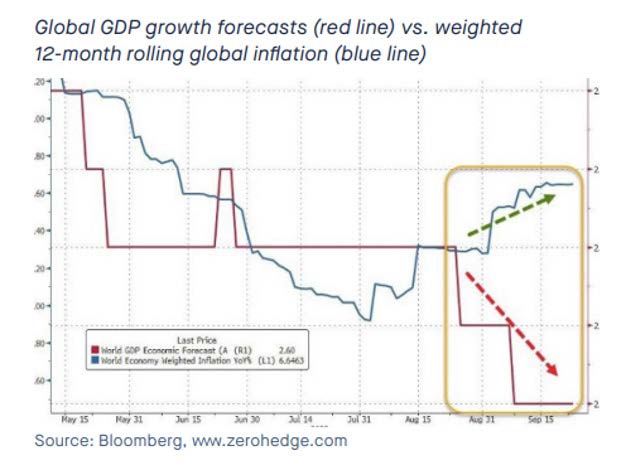
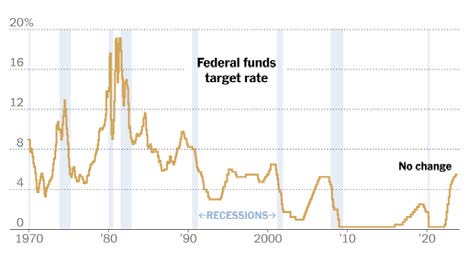
The market has de facto revised the path of interest rates upwards: the Fed's futures contracts no longer point to rate cuts before September 2024. To put things in perspective, three months ago, the futures contracts were forecasting 4 rate cuts in 2023. Today, the market expects interest rates to pause for at least a year.

Syz-Feature_QR10charts_231005_i05

Source: The New York Times


Chart #5 — 

The SNB puts an end to the monetary tightening cycle


The SNB left its key rate unchanged at 1.75%, thwarting market expectations of a further 25 basis point rise. Underlying this decision are the slowdown in inflation, the extent of the monetary policy tightening already implemented (short-term Swiss franc rates were still negative a year ago) and the growing risks surrounding the global outlook.
Indeed, with inflation in line with the SNB's target (1.6%, within the 0%-2% range), economic activity slowing (0% GDP growth in the second quarter of 2023) and the Swiss franc remaining firm, the case for further tightening had become much less convincing in recent weeks. Unlike the ECB, which was forced to raise rates the previous week because inflation was still well above its target, the SNB had very good reasons to pause and adopt a cautious stance. 
However, the SNB is not ruling out further hikes in the future, if necessary. It is also interesting to compare the SNB's decision and body language with those of the Fed and the ECB.

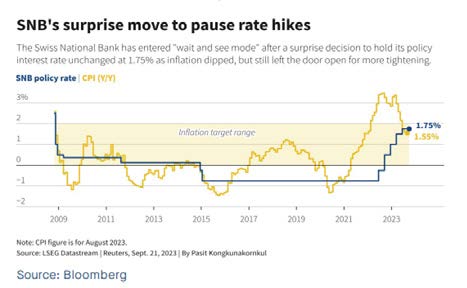
Indeed, Mrs. Lagarde and Mr. Powell left an impression of great confusion. On the one hand, they were obliged to acknowledge that the battle against inflation was not yet won. On the other, they shared their fears about the impact of higher rates on the economic cycle. In the case of the SNB, things are much clearer. Inflation is already within the SNB's target range. Activity is slowing down. These two factors allow the SNB to come up with a clear and unambiguous decision: the end of rate hikes for this cycle. And if economic activity were to accelerate or slow too much, the SNB has several options available.

Syz-Feature_QR10charts_231005_i06


Chart  #6 — 

Oil supply deficit set to worsen in Q4

This chart from Bloomberg shows the huge supply deficit that oil markets will face over the next quarter. OPEC is forecasting a supply deficit of more than 3 million barrels a day. If OPEC is right, the result will be the biggest reduction in stocks since 2007. Voluntary production cuts by OPEC members are removing an additional 1.3 million barrels from the oil supply every day. This shortfall is taking place against a backdrop of rising oil prices and at a time when US reserves are at their lowest.

Syz-Feature_QR10charts_231005_i07


Chart #7 — 

A change in cross-assets leadership

After a strong first half of the year for stocks, a change in leadership took place during the third quarter. Commodity (+4.7%) was the best performing asset class during the quarter but remains nevertheless in the red on a year-to-date basis (-3.4%). Oil recorded a strong performance in the 3rd quarter (+32.6% for US WTI crude oil benchmark) on the back of supply/demand imbalance prospects (see chart #6).   
Developed market equities fell by -3.4% over the quarter, taking year-to-date returns down to a still strong 11.6%. Value stocks (-1.7%) were more resilient than growth stocks (-4.9%). However, growth continues to lead year to date with an 18% outperformance. MSCI Emerging Markets (-2.8%) fared slightly better than developed markets equities. From a country perspective, Japan Topix (+2.5%) was the best performer in Q3 and continues to lead on a year-to-date basis (+25.7%). The S&P 500 was down -3.3% over the quarter but is still up +13.1% year-to-date (as of the end of September). MSCI Europe ex-UK was the worst quarterly performer (-3.4%) but remains up 10% year-to-date. 

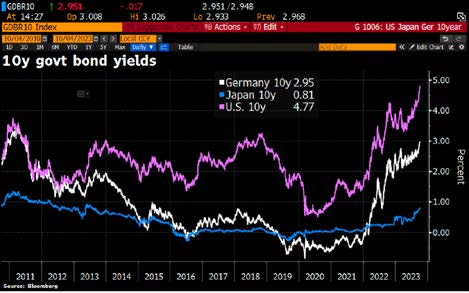
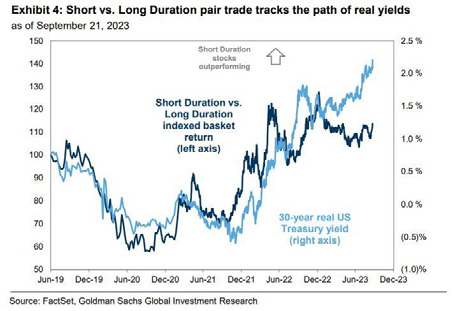
A sell-off in global bond markets was partly to blame for the pressure on risk assets, with the global aggregate bond benchmark falling by -3.6% in the third quarter. The US Treasury market was a notable laggard, while in credit, the lower interest rate sensitivity of high yield bond benchmarks helped both the US and European high yield bond markets to eke out positive returns, returning 0.5% and 1.5% respectively. On a year-to-date basis, the global aggregate bond index is down -2.2%. 
We note that correlation between bonds and stocks spiked in the 3rd quarter, echoing the market dynamics of 2022.

Syz-Feature_QR10charts_231005_i08


Chart #8 — 

The surge in long-dated bond yields


The yield on 10-year US Treasury bonds continues to rise, reaching a high of 4.63% at the end of the quarter, its highest level since June 2007 (at the time of our writing, the 10-year trades at 4.77%). Between the Fed's last meeting and the end of the quarter, the yield on 10-year bonds has risen by 35 basis points. Since the Fed's last rate hike in July, the yield has risen by 60 basis points. In the meantime, the Fed's rate hike forecasts have not changed. In fact, the current yield curve has revised downwards the probability of another rate hike this year. How can we explain the upward acceleration in 10-year yields?
Firstly, the market seems to have accepted that the Federal Reserve will take a long pause. Previously, investors were expecting a large number of rate cuts as early as 2024. The current curve now anticipates just two rate cuts next year. In addition, strong bond issuance by the US Treasury at a time when the Federal Reserve is accelerating the reduction in the size of its balance sheet through Quantitative Tightening (QT) is creating unfavourable supply/demand conditions for longdated bonds.
This upward movement in bond yields is contributing to the rise in the dollar and weighing on equity valuations, particularly those of so-called growth stocks (e.g. Technology) – see next chart.

Syz-Feature_QR10charts_231005_i09

Source: Bloomberg


Chart #9 — 

Short duration stocks outperform long duration stocks


A regime change has been in place over the second half of the quarter. Despite the rise in 30-year real yields, short duration stocks (i.e value and the likes) were underperforming long duration ones (i.e IT/growth stocks). Things are now normalizing as short duration stocks are progressively catching up in terms of relative performance. The growth/IT basket probably needs 30-year real yield to reverse trend in order to outperform again.

Syz-Feature_QR10charts_231005_i10


Chart #10 — 

The king dollar

The U.S. Dollar Index ($DXY) recently experienced its 10th successive week of gains, marking its longest period of increase in 9 years. The flight to safety, the yield differential between US and the rest of the world and the macroeconomic weakness observed in Europe and Asia have been pushing the greenback upward.

Syz-Feature_QR10charts_231005_i11

Source: FT


Disclaimer

This marketing document has been issued by Bank Syz Ltd. It is not intended for distribution to, publication, provision or use by individuals or legal entities that are citizens of or reside in a state, country or jurisdiction in which applicable laws and regulations prohibit its distribution, publication, provision or use. It is not directed to any person or entity to whom it would be illegal to send such marketing material. This document is intended for informational purposes only and should not be construed as an offer, solicitation or recommendation for the subscription, purchase, sale or safekeeping of any security or financial instrument or for the engagement in any other transaction, as the provision of any investment advice or service, or as a contractual document. Nothing in this document constitutes an investment, legal, tax or accounting advice or a representation that any investment or strategy is suitable or appropriate for an investor's particular and individual circumstances, nor does it constitute a personalized investment advice for any investor. This document reflects the information, opinions and comments of Bank Syz Ltd. as of the date of its publication, which are subject to change without notice. The opinions and comments of the authors in this document reflect their current views and may not coincide with those of other Syz Group entities or third parties, which may have reached different conclusions. The market valuations, terms and calculations contained herein are estimates only. The information provided comes from sources deemed reliable, but Bank Syz Ltd. does not guarantee its completeness, accuracy, reliability and actuality. Past performance gives no indication of nor guarantees current or future results. Bank Syz Ltd. accepts no liability for any loss arising from the use of this document.

Read More

Straight from the Desk

Syz the moment

Live feeds, charts, breaking stories, all day long.

Thinking out loud

Sign up for our weekly email highlighting the most popular posts.

Follow us

Thinking out loud

Investing with intelligence

Our latest research, commentary and market outlooks